
CHEMISTRY GLOSSARY

Ostwald’s viscometer → Ostwaldov viskozimetar
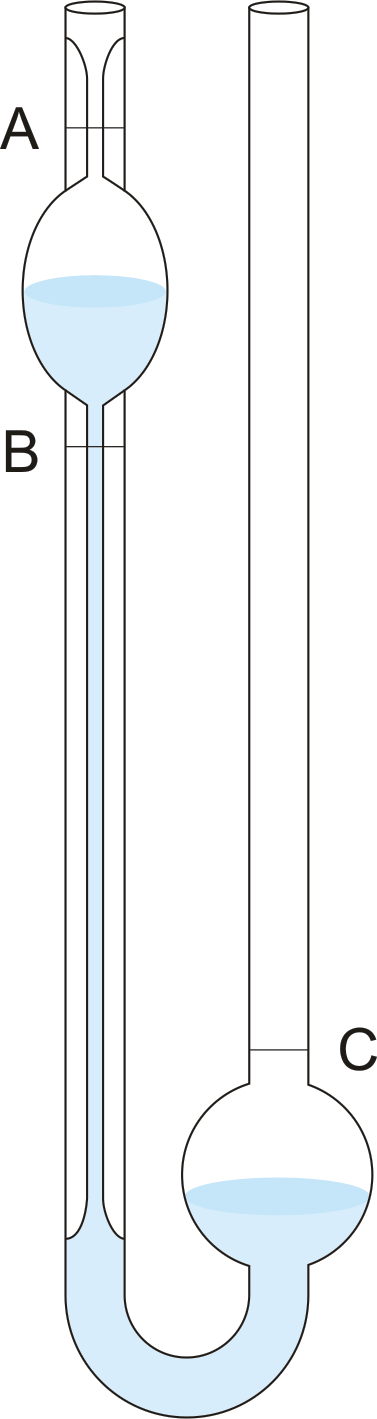
Ostwald viscometer, also known as U-tube viscometer or capillary viscometer is a device used to measure the viscosity of the liquid with a known density. The method of determining viscosity with this instrument consists of measuring the time for a known volume of the liquid (the volume contained between the marks A and B) to flow through the capillary under the influence of gravity. Ostwald viscometers named after the German chemist Wilhelm Ostwald (1853-1932).
The instrument must first be calibrated with materials of known viscosity such as pure (deionized) water. Knowing the value of viscosity of one liquid, one can calculate the viscosity of other liquid.
where η1 and η2 are viscosity coefficients of the liquid and water, and ρ1 and ρ2 are the densities of liquid and water, respectively.
phase diagram → fazni dijagram
Phase diagram is a graphic representation of the equilibrium relationships between phases (such as vapour-liquid, liquid-solid) of a chemical compound, mixture of compounds, or solution.
The figure shows a typical phase diagram of an element or a simple compound. The stability of solid, liquid and gas phases depends on the temperature and the pressure. The three phases are in equilibrium at the triple point. The gas and liquid phases are separated by a phase transition only below the temperature of the critical point.

polar molecule → polarna molekula
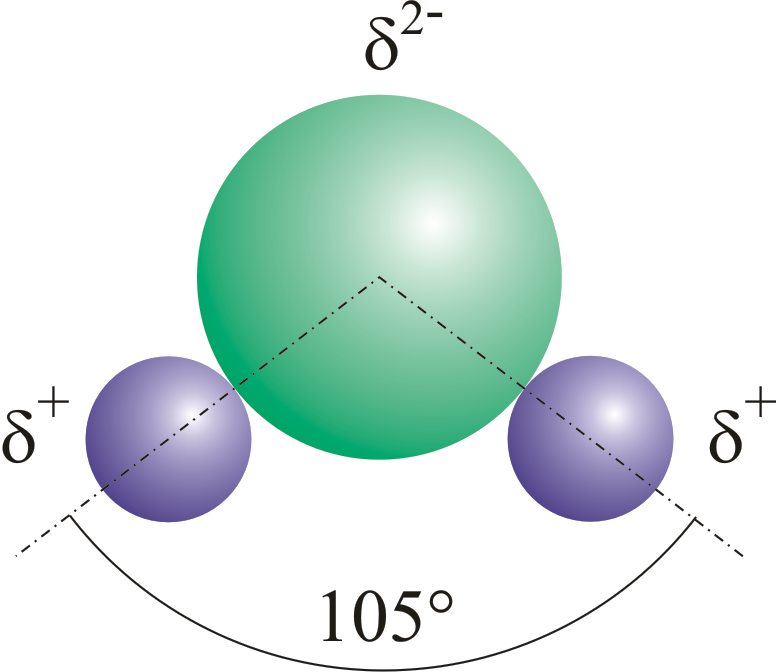
Polar molecules are molecules at which centres of gravity of positive and negative charge are not in the same point.
potentiometric titration → potenciometrijska titracija
Potentiometric titration is a volumetric method in which the potential between two electrodes is measured (referent and indicator electrode) as a function of the added reagent volume. Types of potentiometric titrations for the determination of analytes in photoprocessing solutions include acid-base, redox, precipitation, and complexometric.
Potentiometric titrations are preferred to manual titrations, since they are more accurate and precise. They are also more easily adapted to automation, where automated titration systems can process larger volumes of samples with minimal analyst involvement.
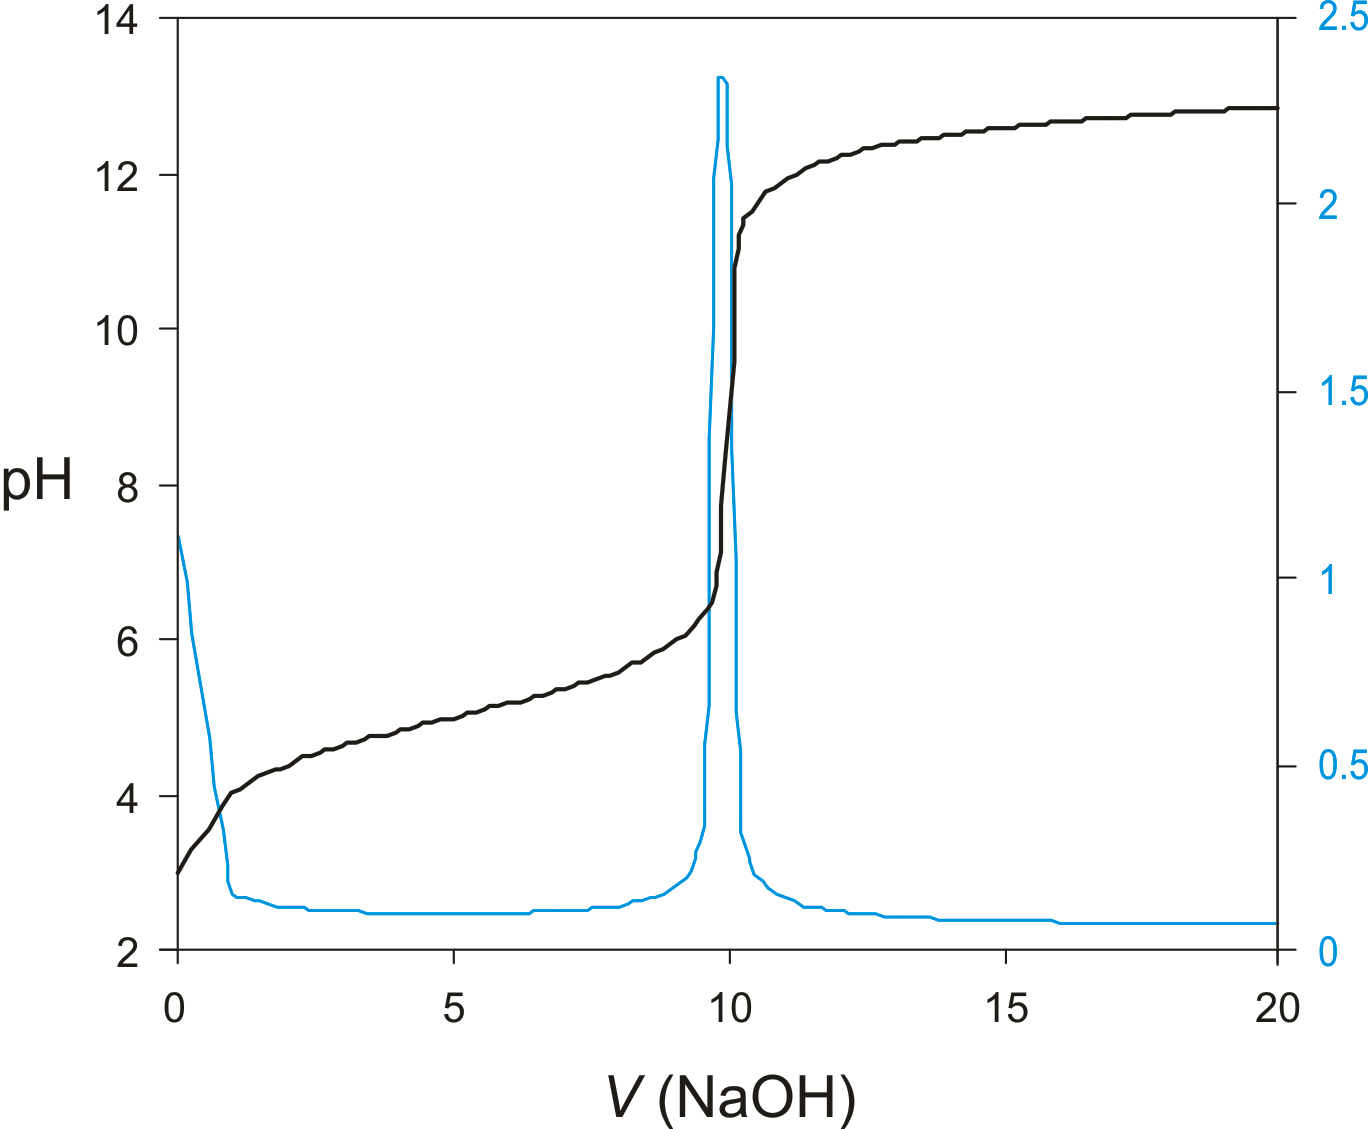
A titration curve has a characteristic sigmoid curve. The part of the curve that has the maximum change marks the equivalence point of the titration. The first derivative, ΔE/ΔV, is the slope of the curve, and the endpoint occurs at the volume, V', where ΔE/ΔV has the maximum value.
retardation factor → faktor zaostajanja
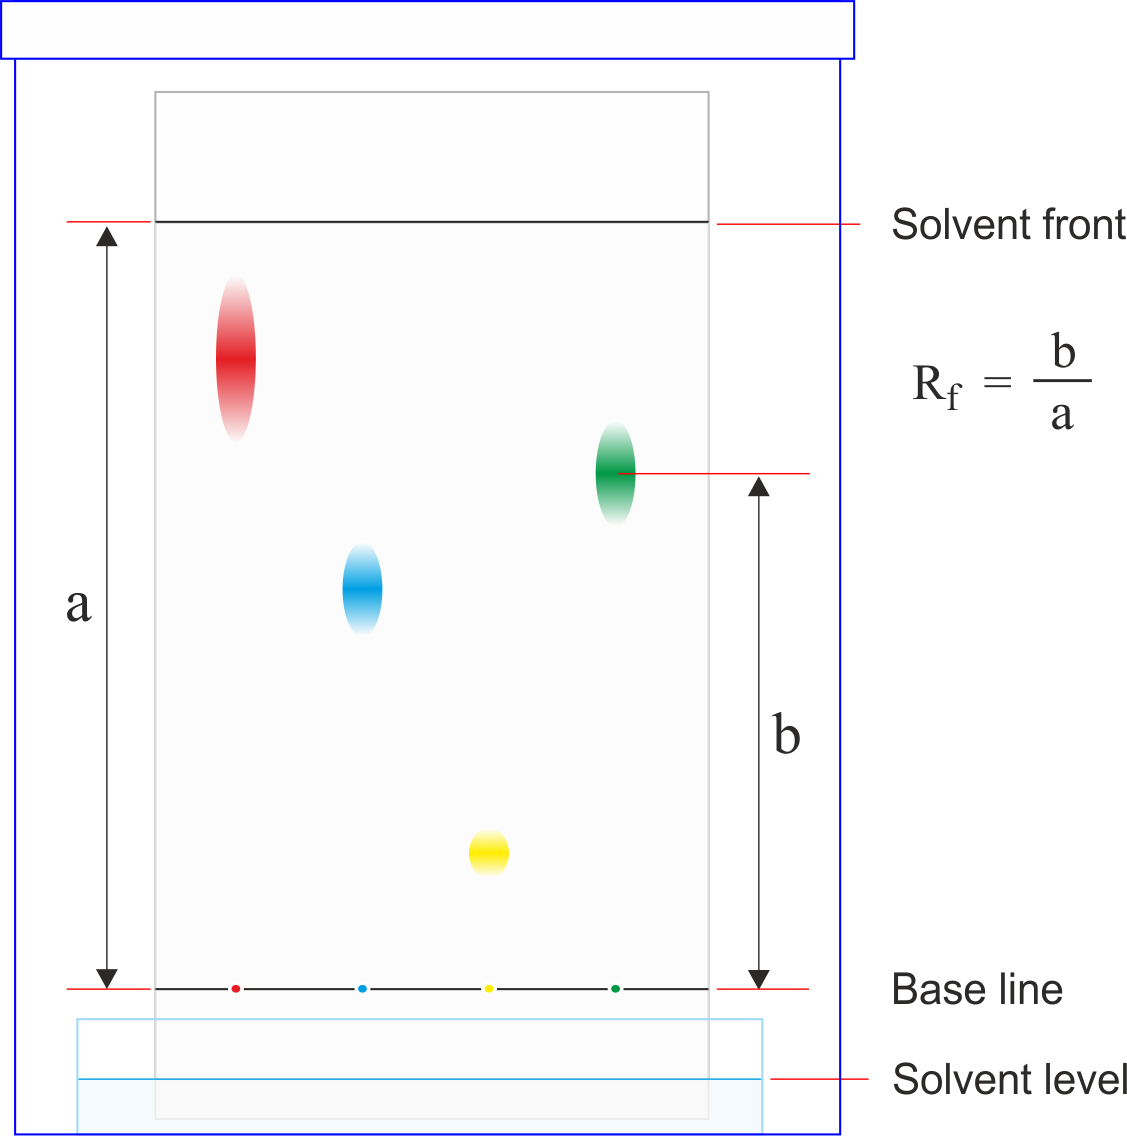
Retardation factor, RF, (in planar chromatography) is a ratio of the distance travelled by the centre of the spot to the distance simultaneously travelled by the mobile phase:
The RF value is characteristic for any given compound on the same stationary phase using the same mobile phase for development of the plates. Hence, known RF values can be compared to those of unknown substances to aid in their identifications.
superfluid helium → superfluidni helij
Superfluidity in helium-4 was discovered in 1938 by the Soviet physicist Pyotr Leonidovich Kapitsa. Helium-4 exhibits superfluidity when it is cooled below 2.18 K (-270.97 C), which is called the lambda (λ) point. At these temperatures, helium-4 exhibits the characteristics of two distinct fluids, one of which appears to flow without friction. An extensive series of experiments showed that in this state of helium, called helium II (He II), there is an apparent enormous rise in heat conductivity, at an increase rate of about three million. Another unusual property of He II is its mobile, rapid flow through capillaries or over the rim of its containment vessel as a thin film that exhibits no measurable viscosity and appears unaffected by the forces of gravity or evaporation and condensation.
titration curve → titracijska krivulja
Titration curve is a graphic representation of the amount of a species present vs. volume of solution added during a titration. A titration curve has a characteristic sigmoid curve. The inflection point in the titration curve marks the end-point of the titration. Blue line is the first derivative of the titration curve.
Citing this page:
Generalic, Eni. "Materijalna točka." Croatian-English Chemistry Dictionary & Glossary. 29 June 2022. KTF-Split. {Date of access}. <https://glossary.periodni.com>.