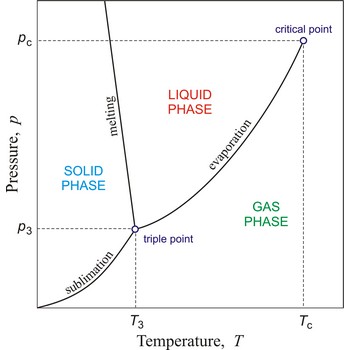
Phase diagram is a graphic representation of the equilibrium relationships between phases (such as vapour-liquid, liquid-solid) of a chemical compound, mixture of compounds, or solution.
The figure shows a typical phase diagram of an element or a simple compound. The stability of solid, liquid and gas phases depends on the temperature and the pressure. The three phases are in equilibrium at the triple point. The gas and liquid phases are separated by a phase transition only below the temperature of the critical point.
Citing this page:
Generalic, Eni. "Phase diagram." Croatian-English Chemistry Dictionary & Glossary. 29 June 2022. KTF-Split. {Date of access}. <https://glossary.periodni.com>.
Glossary
Periodic Table
Find in dictionary:
Copyright © 2004-2023 by Eni Generalic. All rights reserved. | Disclaimer

