
CHEMISTRY GLOSSARY
Tafel plot → Tafelov dijagram
Tafel plot is the graph of the logarithm of the current density j against the overpotential η in electrochemistry in the high overpotential limit. An electrode when polarised frequently yields a current potential relationship over a region which can be approximated by:
where η is change in open circuit potential, i is the current density, B and i0 is constants. B is known as the Tafel Slope. If this behaviour is observed a plot of the semilogarithmic components is known as the Tafel line and the diagram is called the Tafel diagram.
thallium → talij
Thallium was discovered by Sir William Crookes (England) in 1861. The origin of the name comes from the Greek word thallos meaning green twig or green shoot. It is soft grey metal that looks like lead. Tarnishes in moist air. Reacts in heated moist air and in acids. Compounds highly toxic by inhalation or ingestion. Cumulative effects. Thallium is found in iron pyrites. Also in crookesite, hutchinsonite and lorandite. Most is recovered from the by-products of lead and zinc refining. Its compounds are used in rat and ant poisons. Also for detecting infrared radiation.
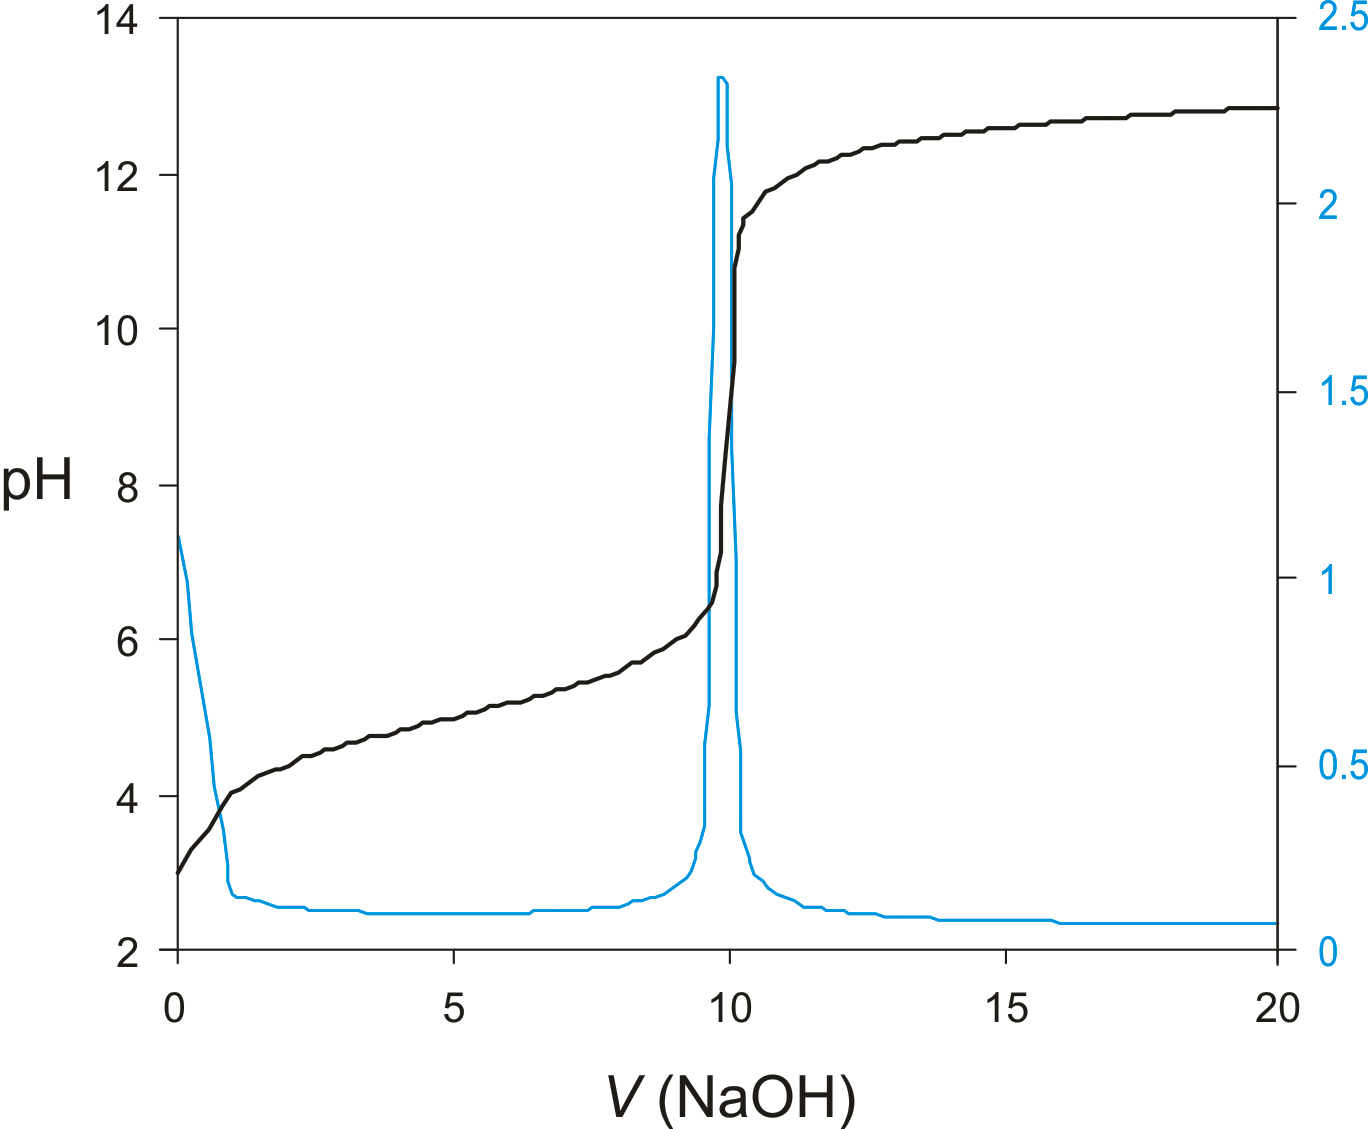
titration curve → titracijska krivulja
Titration curve is a graphic representation of the amount of a species present vs. volume of solution added during a titration. A titration curve has a characteristic sigmoid curve. The inflection point in the titration curve marks the end-point of the titration. Blue line is the first derivative of the titration curve.
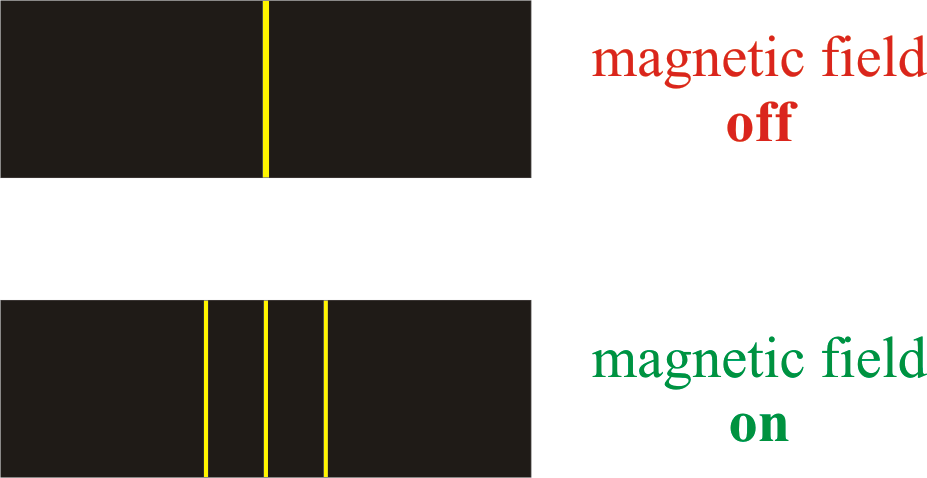
Zeeman effect → Zeemanov efekt
Zeeman effect is the splitting of the lines in a spectrum when the source of the spectrum is exposed to a magnetic field. The effect was discovered in 1896 by the Dutch physicist Pieter Zeeman (1865-1943) as a broadening of the yellow D-lines of sodium in a flame held between strong magnetic poles.
The Zeeman effect has helped physicists determine the energy levels in atoms. In astronomy, the Zeeman effect is used in measuring the magnetic field of the Sun and of other stars.
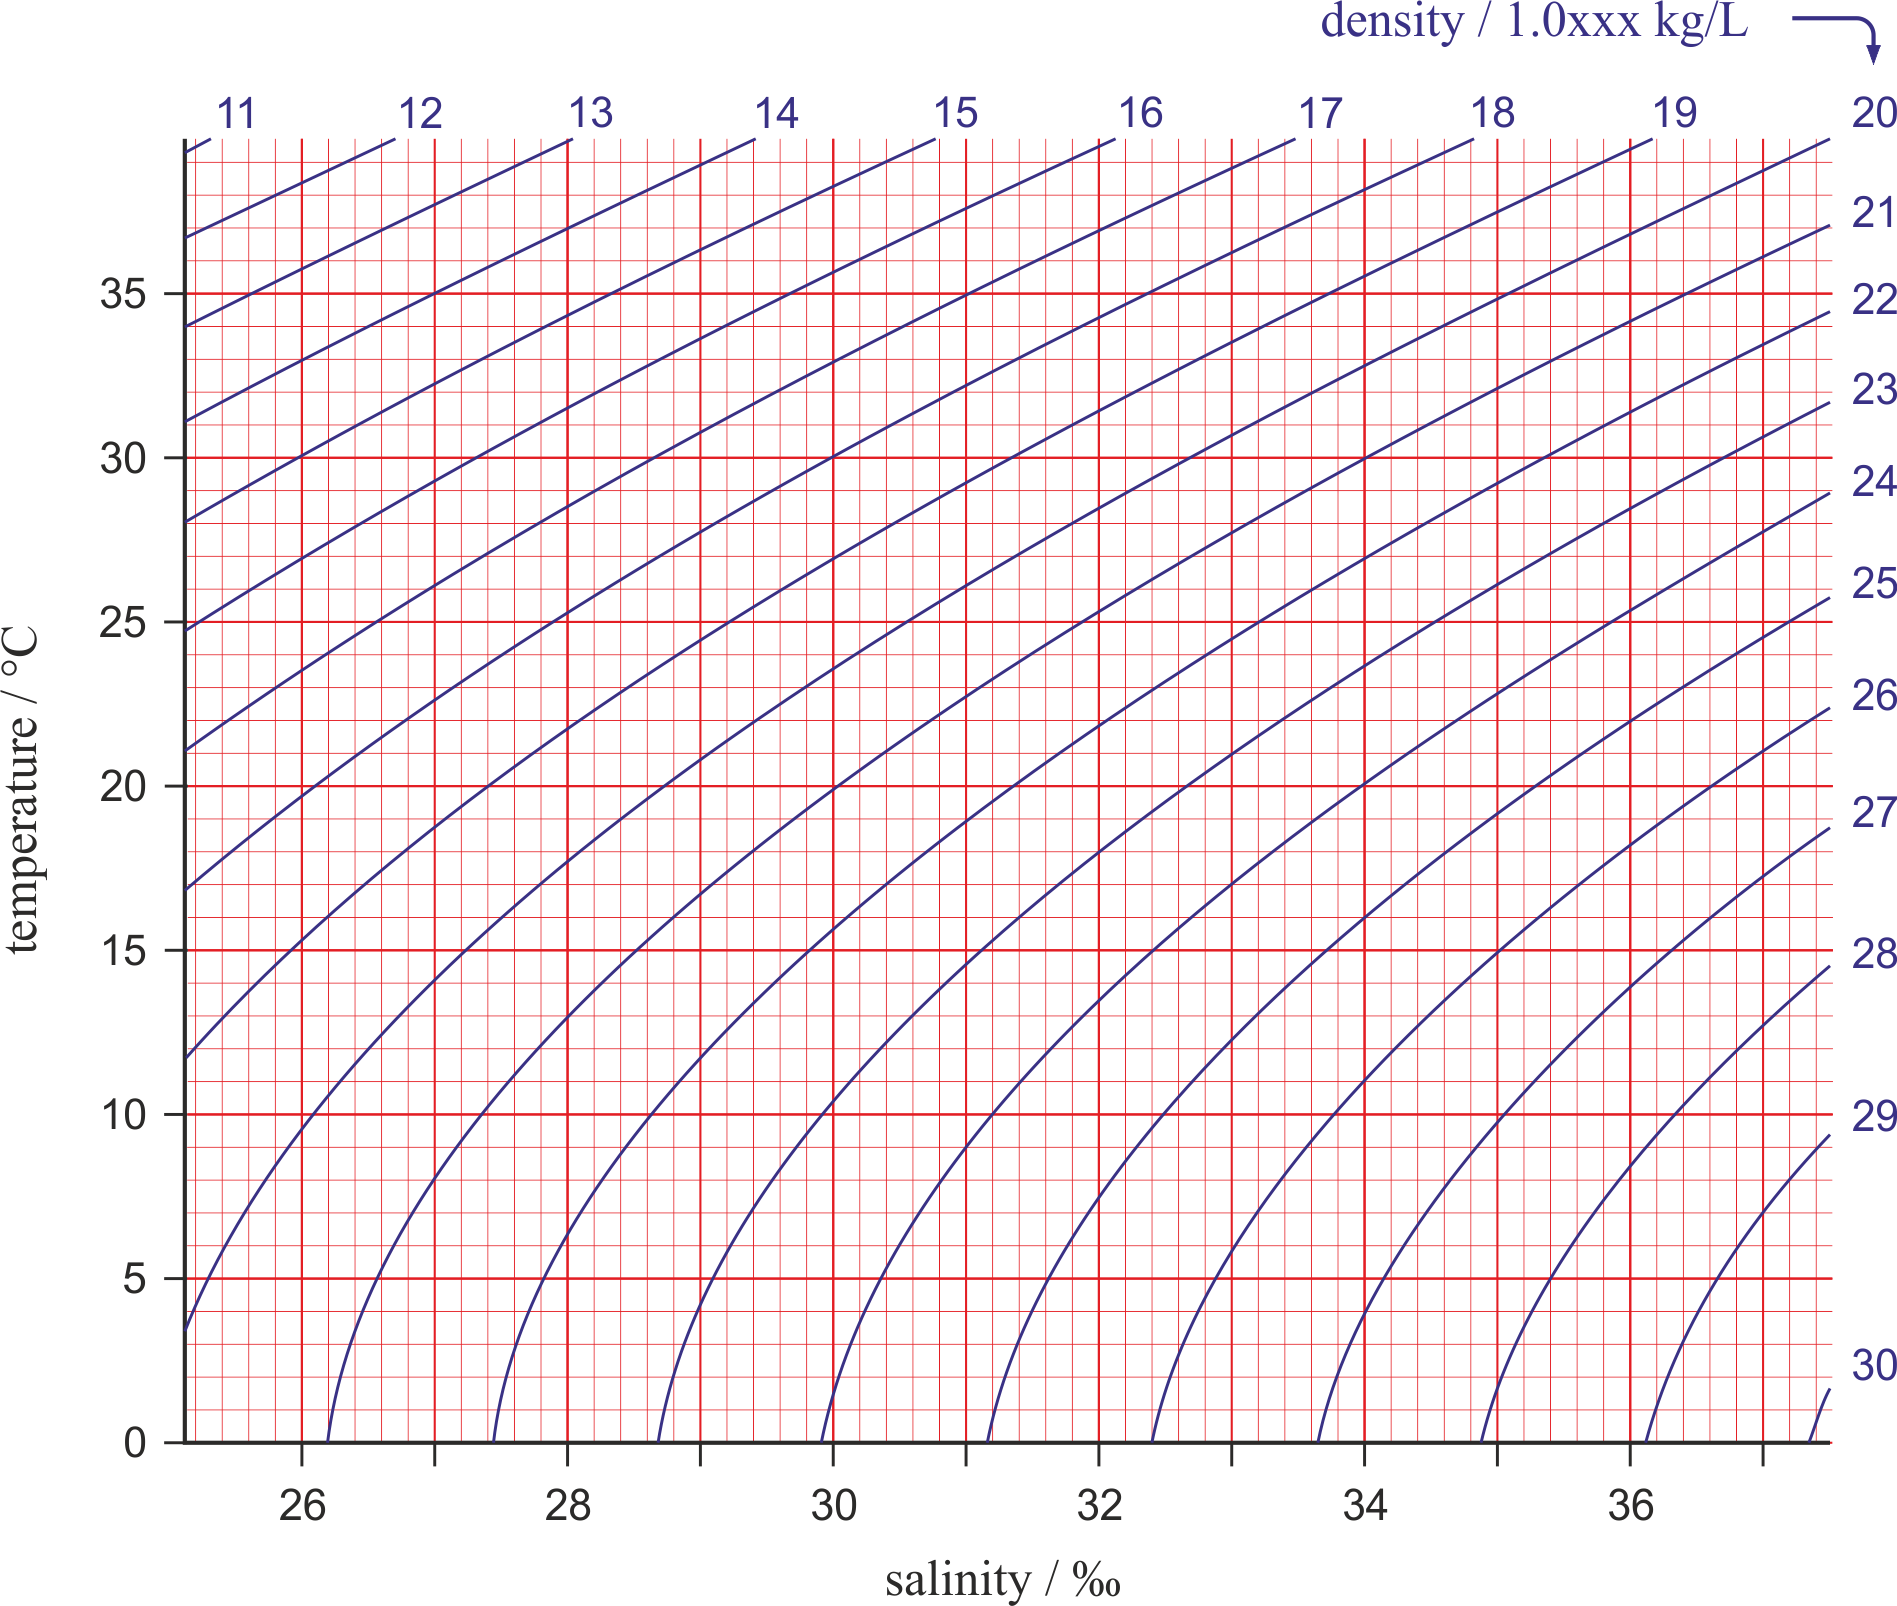
T-S diagram → T-S dijagram
The relationship between the temperature (T) and the salinity (S) of a seawater can be illustrated graphically on a T-S diagram, which is a simple, but powerful tool used in studies of seawater density, mixing, and circulation. In a T-S diagram, temperature is plotted along the vertical axis in degrees Celsius and salinity is measured along the horizontal axis in PSU (Practical Salinity Units). Seawater density is illustrated in the diagram by curved lines of constant density (isopycnals). Water tends to move horizontally throughout the deep ocean, moving along lines of equal density.
Citing this page:
Generalic, Eni. "D-linije." Croatian-English Chemistry Dictionary & Glossary. 29 June 2022. KTF-Split. {Date of access}. <https://glossary.periodni.com>.