
CHEMISTRY GLOSSARY
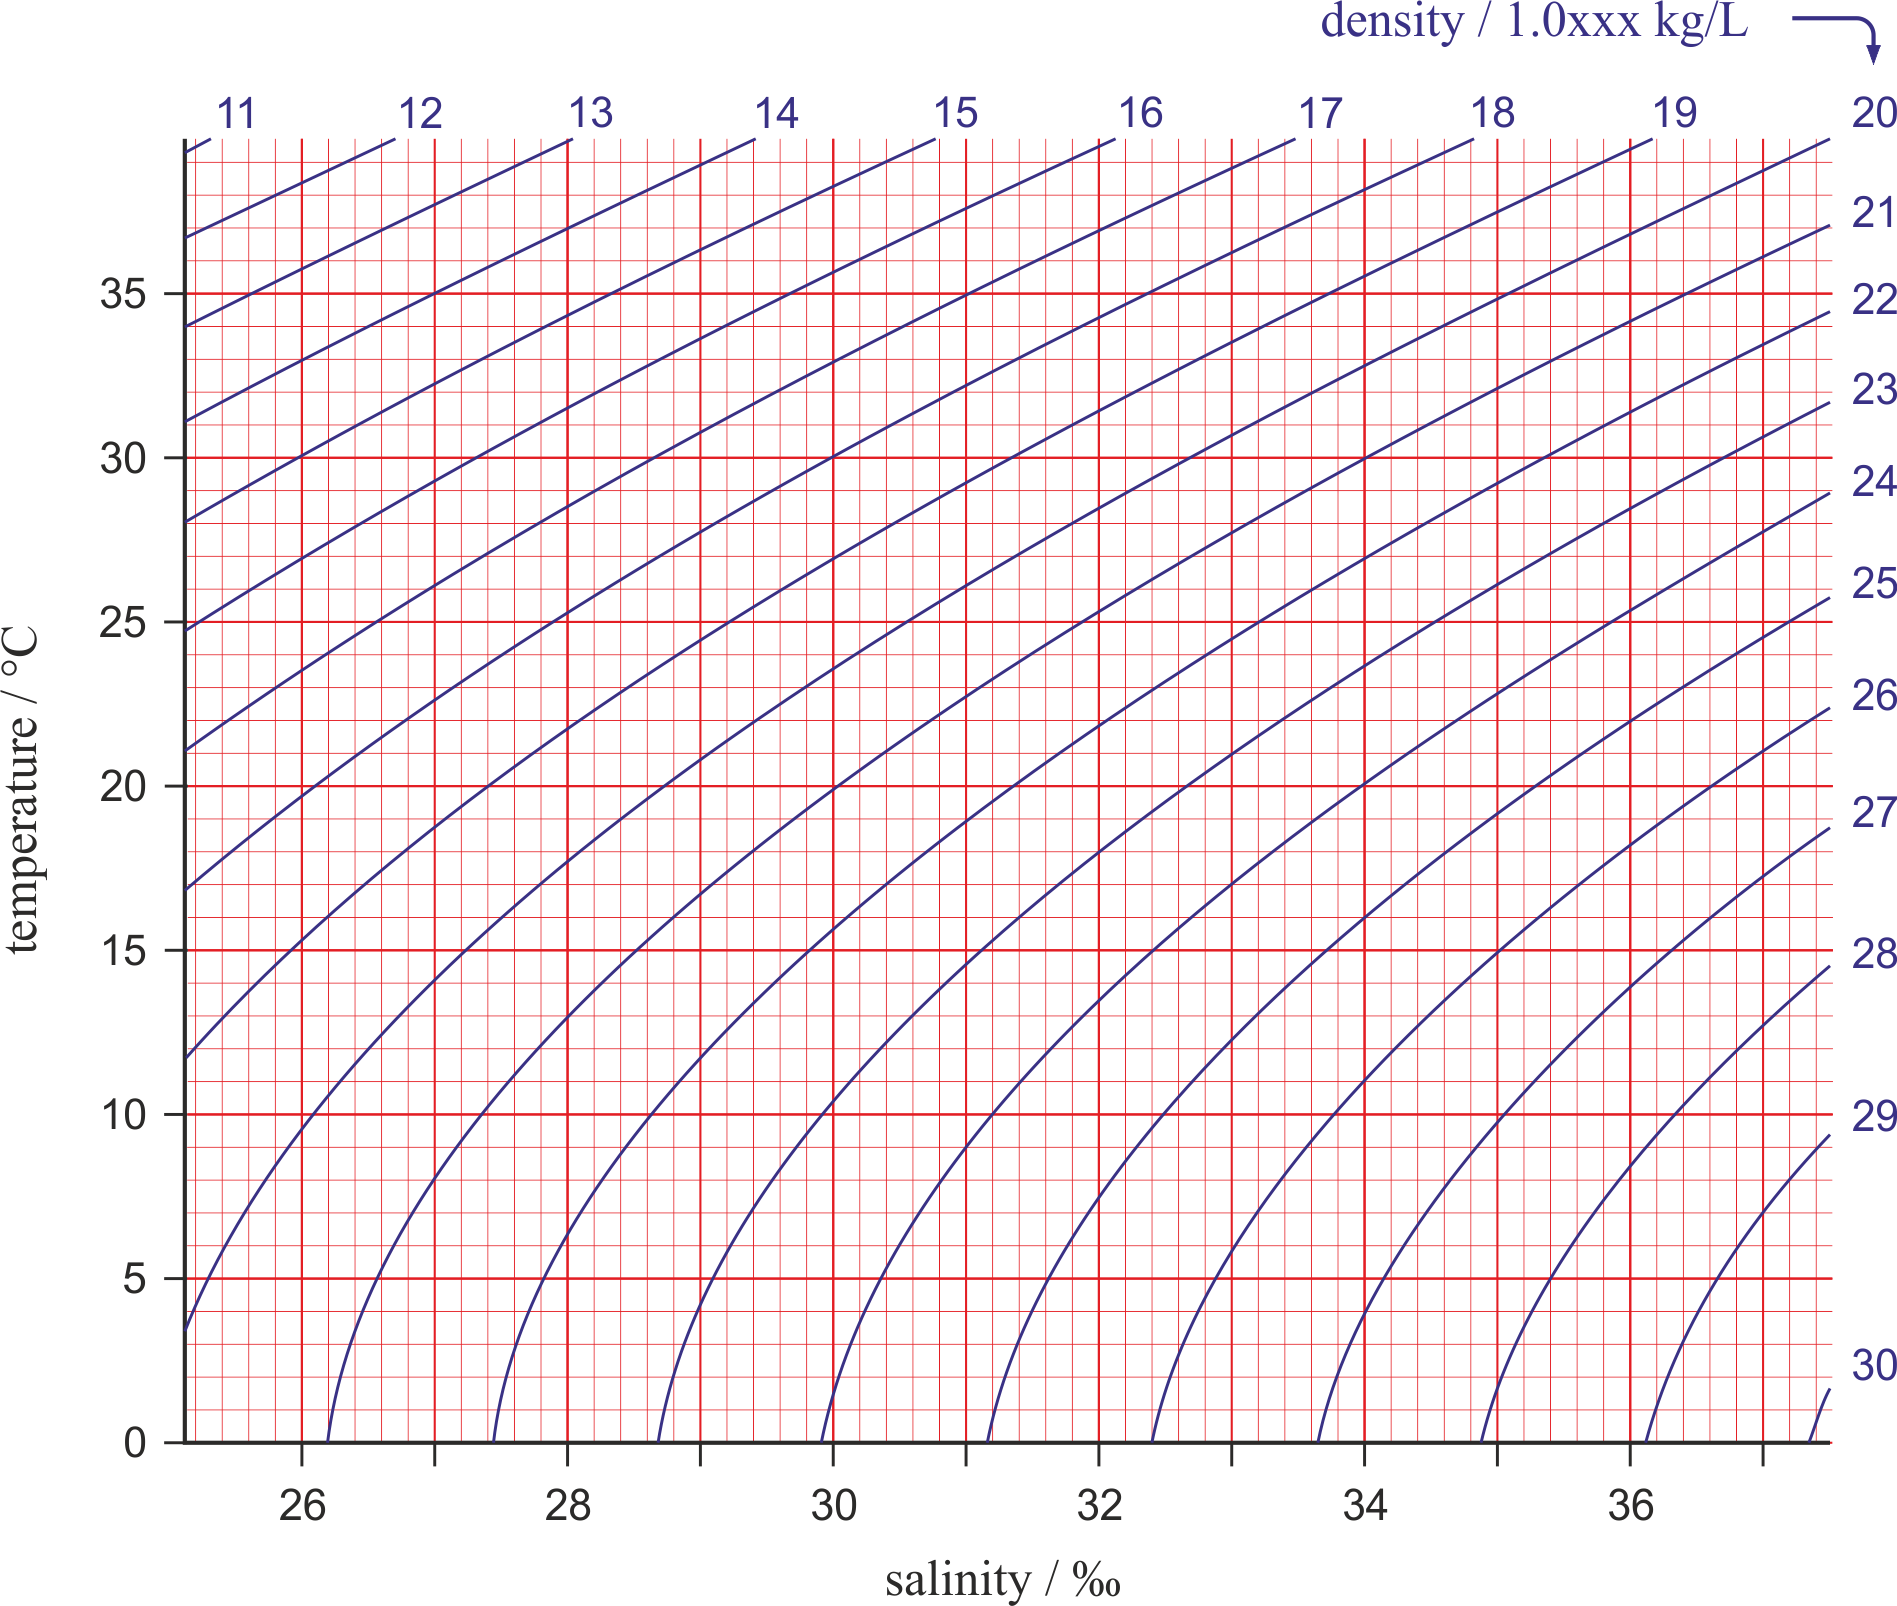
The relationship between the temperature (T) and the salinity (S) of a seawater can be illustrated graphically on a T-S diagram, which is a simple, but powerful tool used in studies of seawater density, mixing, and circulation. In a T-S diagram, temperature is plotted along the vertical axis in degrees Celsius and salinity is measured along the horizontal axis in PSU (Practical Salinity Units). Seawater density is illustrated in the diagram by curved lines of constant density (isopycnals). Water tends to move horizontally throughout the deep ocean, moving along lines of equal density.
Citing this page:
Generalic, Eni. "T-S diagram." Croatian-English Chemistry Dictionary & Glossary. 29 June 2022. KTF-Split. {Date of access}. <https://glossary.periodni.com>.
Find in dictionary:
Copyright © 2004-2023 by Eni Generalic. All rights reserved. | Disclaimer