
CHEMISTRY GLOSSARY
T-S diagram → T-S dijagram
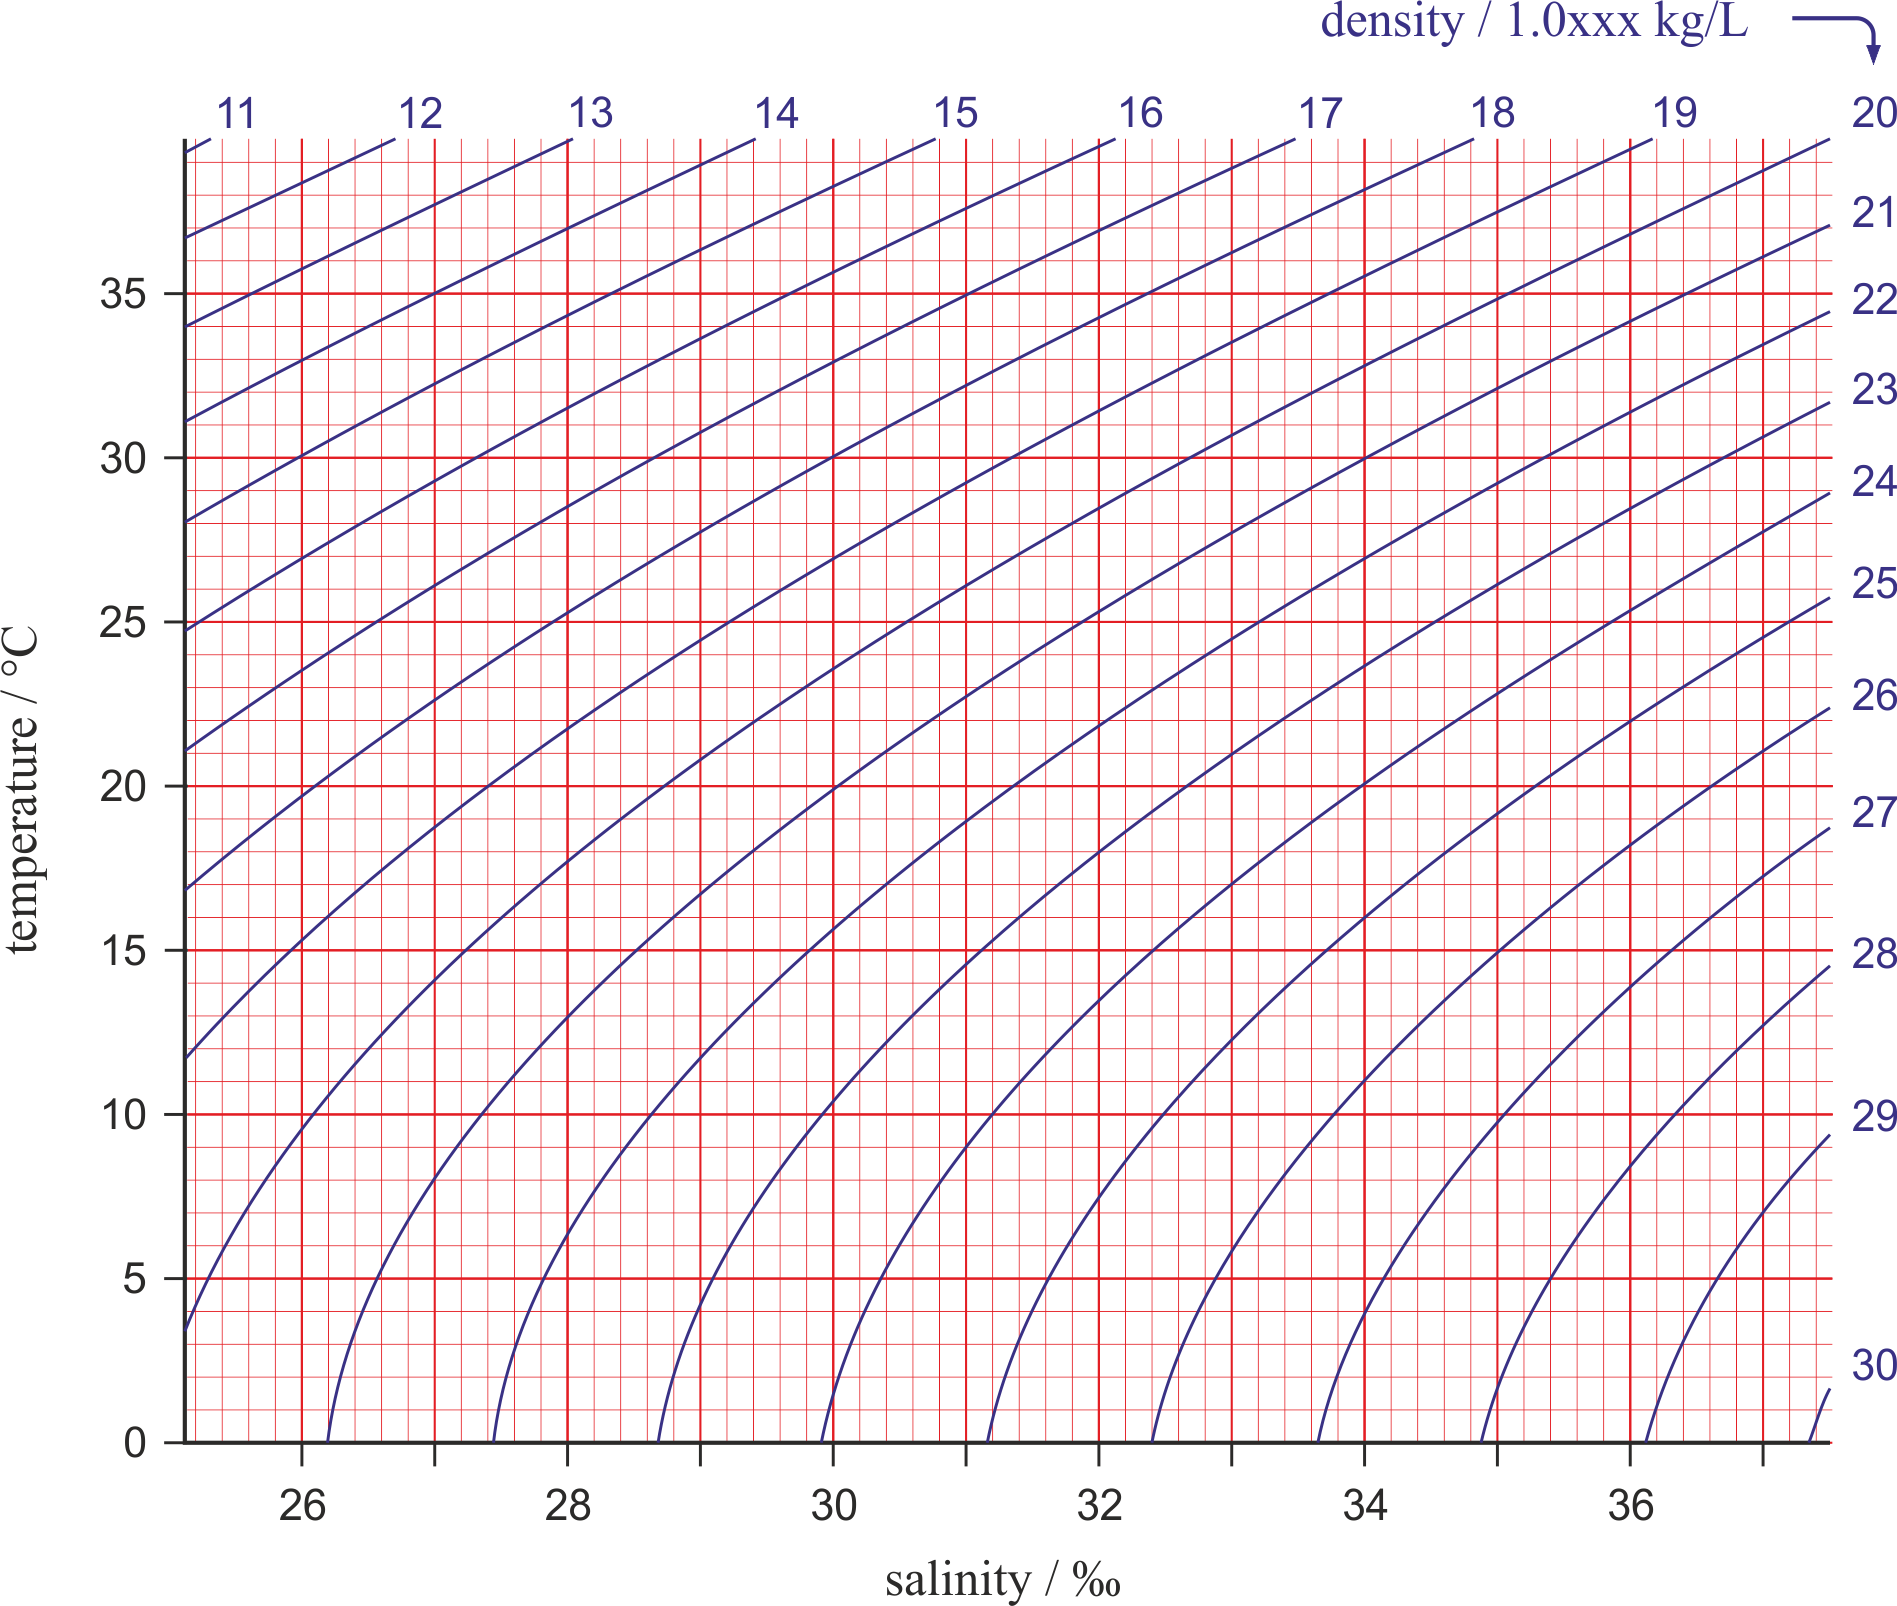
The relationship between the temperature (T) and the salinity (S) of a seawater can be illustrated graphically on a T-S diagram, which is a simple, but powerful tool used in studies of seawater density, mixing, and circulation. In a T-S diagram, temperature is plotted along the vertical axis in degrees Celsius and salinity is measured along the horizontal axis in PSU (Practical Salinity Units). Seawater density is illustrated in the diagram by curved lines of constant density (isopycnals). Water tends to move horizontally throughout the deep ocean, moving along lines of equal density.
Heyrovsky-Ilkovic equation → Heyrovsky-Ilkovičeva jednadžba
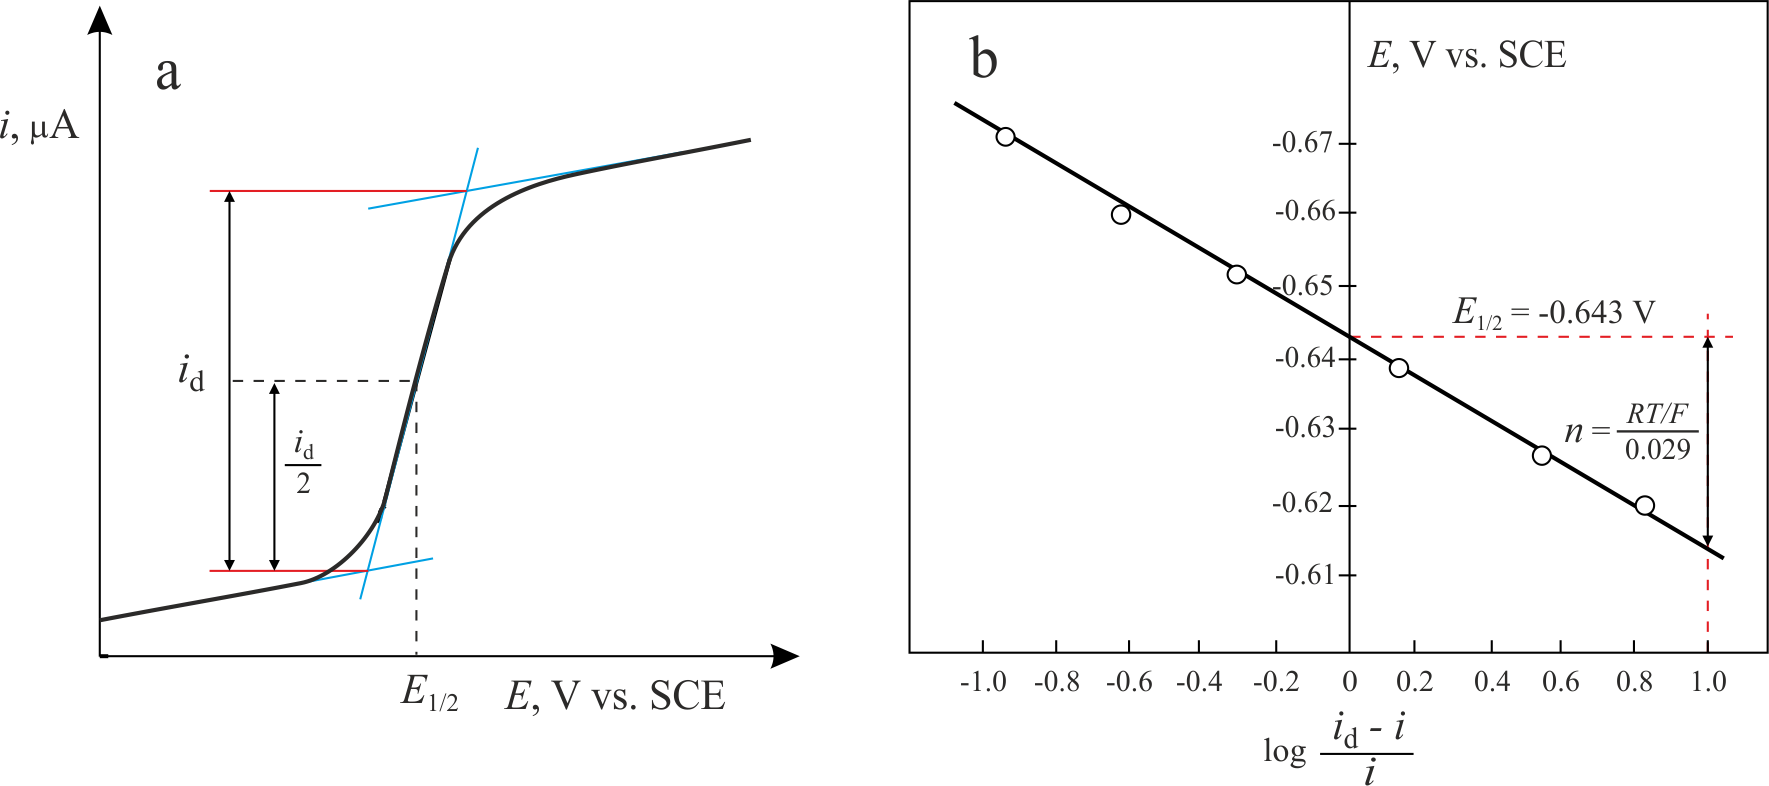
The Heyrovsky-Ilkovic equation describes the entire current-potential curve (polarographic wave) of a reversible redox system in polarography
where R is the gas constant, T is the absolute temperature, F is the Faraday constant, n denotes the number of electrons taking part in the electrode reaction. E1/2 is a unique potential (for a given reaction and supporting electrolyte) termed the half-wave potential.
In order to obtain E1/2 from the above equation, we plot a graph of ln[(id-i)/i] against E. The intercept on the x-axis gives then an accurate value of E1/2. The slope of the obtained straight line is equal to nF/RT from which n is determined.
Citing this page:
Generalic, Eni. "Kritična temperatura." Croatian-English Chemistry Dictionary & Glossary. 29 June 2022. KTF-Split. {Date of access}. <https://glossary.periodni.com>.