
CHEMISTRY GLOSSARY
hypsometric curve → hipsometrijska krivulja
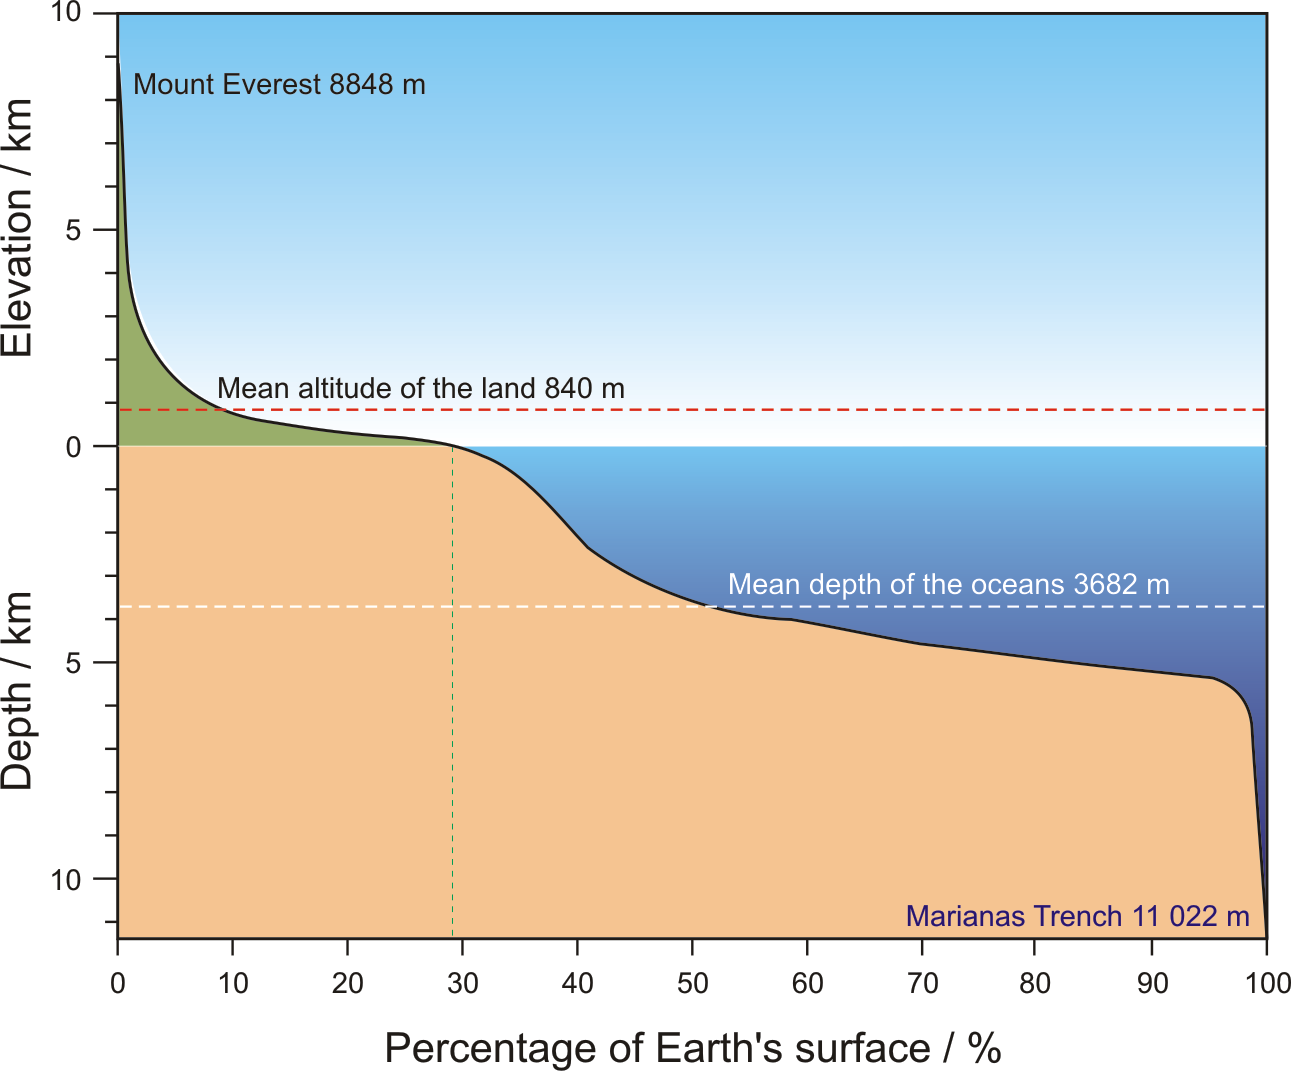
Hypsometric curve (or hypsographic curve) shows the distribution of height of a given area (on land) and depth (at sea). The term originates from the Greek word hypsos meaning height. The part of the curve that reflects the cross section of the ocean bottom is called the bathygraphic curve.
Horizontal dashed lines indicate average height of the continents at 840 meters above sea level, and average depth of the oceans at 3 682.2 meters below sea level. If all the land above sea level (green) was moved into the sea (blue), the oceans would still be 3 km deep.
reaction speed curve → krivulja brzine reakcije
Reaction speed curve is a graphic presentation of the reactant quantity change in dependence on time value.
solubility curve → krivulja topljivosti
Solubility curve is a graphic presentation of solubility change in dependence on temperature.
titration curve → titracijska krivulja
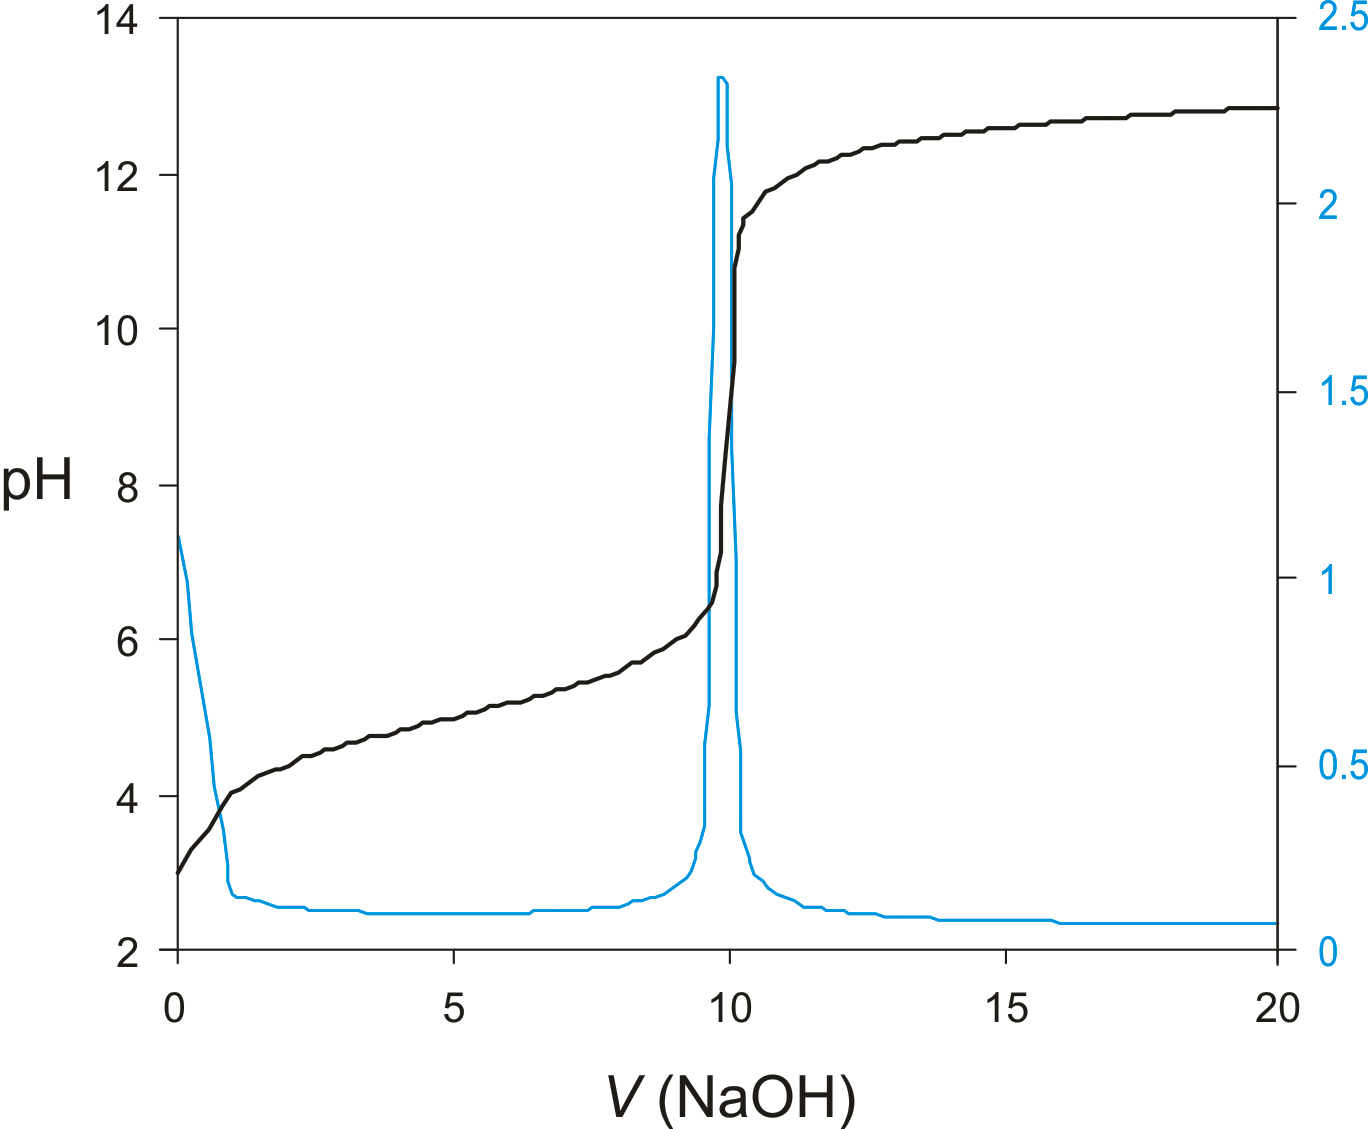
Titration curve is a graphic representation of the amount of a species present vs. volume of solution added during a titration. A titration curve has a characteristic sigmoid curve. The inflection point in the titration curve marks the end-point of the titration. Blue line is the first derivative of the titration curve.
Carnot cycle → Carnotov kružni proces
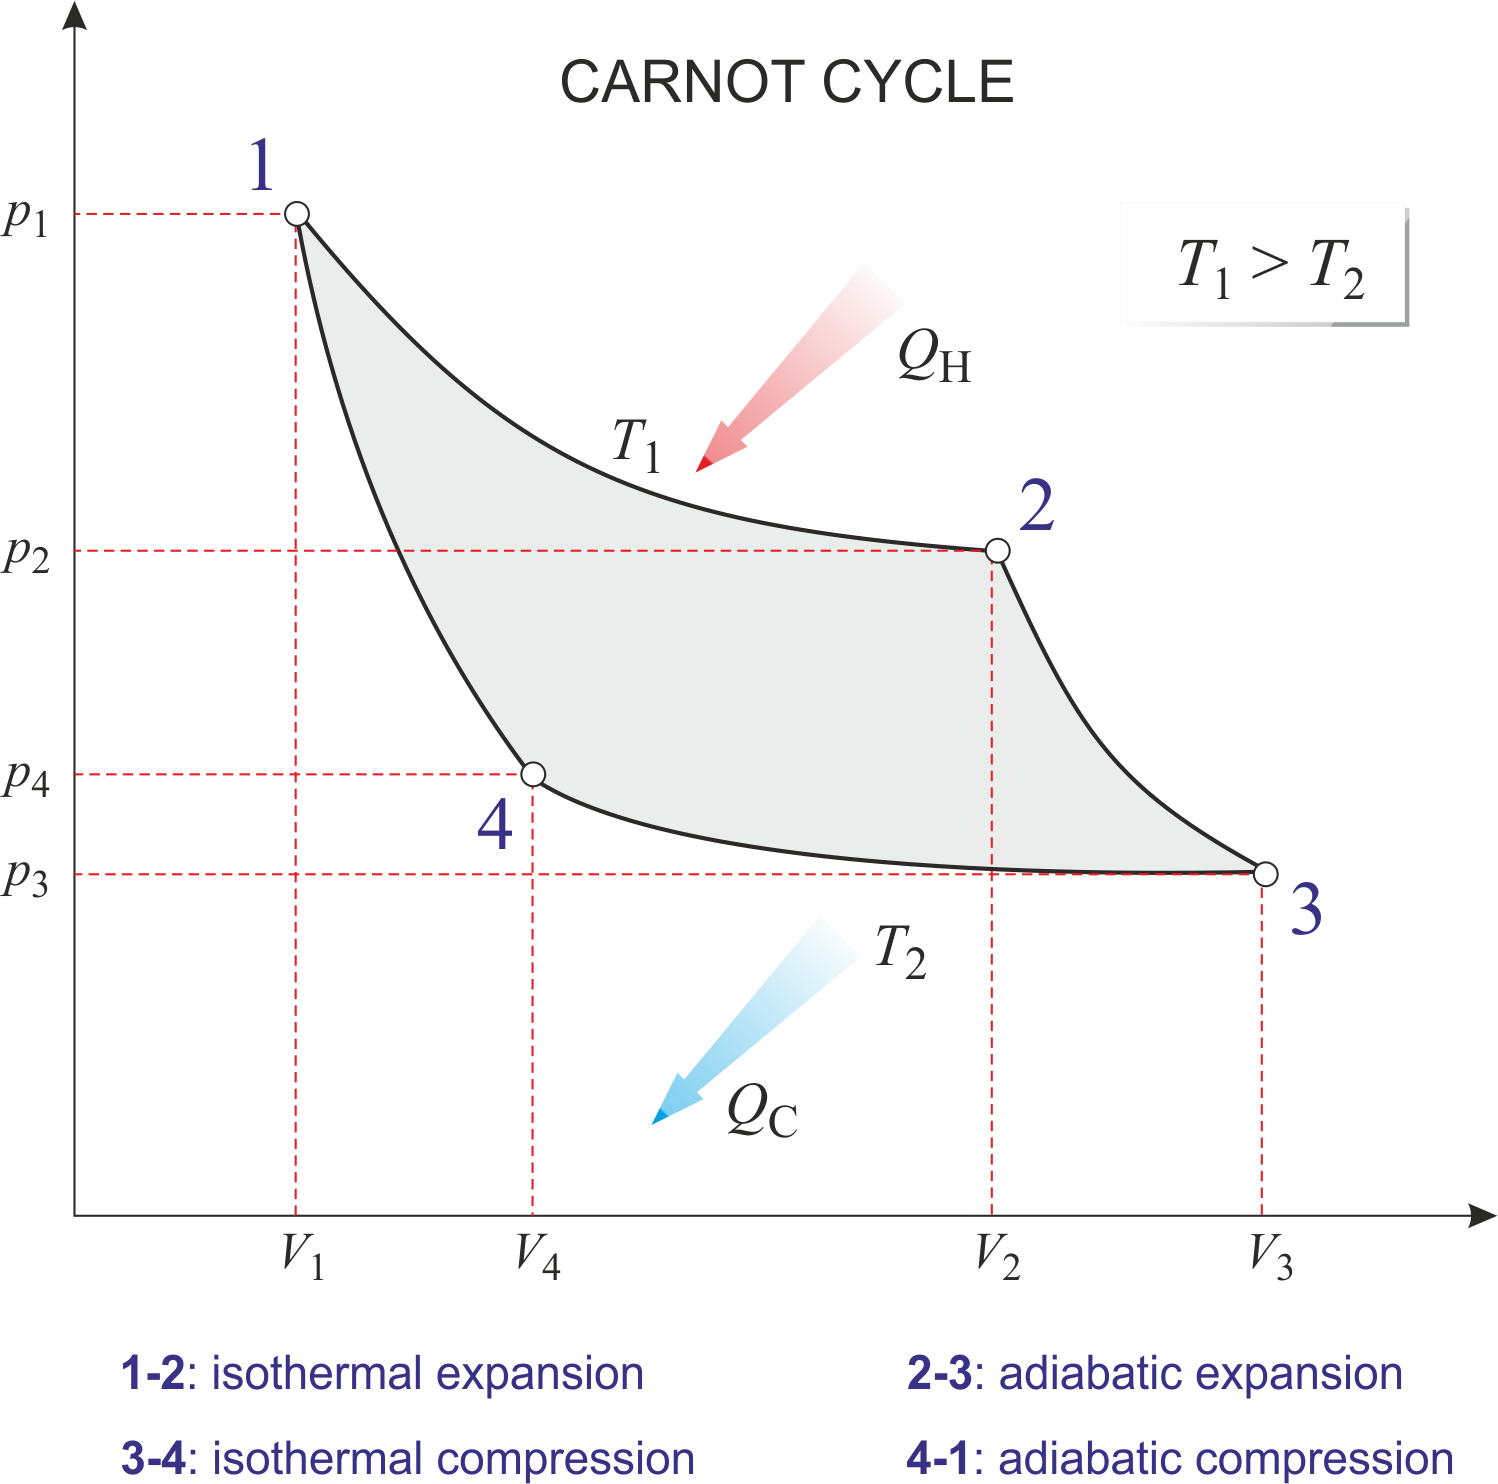
Carnot cycle is the most efficient cycle of operations for a reversible heat engine. Published in 1824 by French physicist Nicolas Léonard Sadi Carnot (1796-1832), it consists of four operations on the working substance in the engine:
1-2: Isothermal expansion at thermodynamic temperature T1 with heat QH taken in.
2-3: Adiabatic expansion with a fall of temperature to T2.
3-4: Isothermal compression at temperature T2 with heat QC given out.
4-1: Adiabatic compression at temperature back to T1.
According to the Carnot principle, the efficiency of any reversible heat engine depends only on the temperature range through which it works, rather than the properties of the working substances.
critical point → kritična točka
In general, critical point is the point on the phase diagram of a two-phase system at which the two coexisting phases have identical properties and therefore represent a single phase. At the liquid-gas critical point of a pure substance, the distinction between liquid and gas vanishes, and the vapour pressure curve ends. The coordinates of this point are called the critical temperature and critical pressure. Above the critical temperature it is not possible to liquefy the substance.

phase diagram → fazni dijagram
Phase diagram is a graphic representation of the equilibrium relationships between phases (such as vapour-liquid, liquid-solid) of a chemical compound, mixture of compounds, or solution.
The figure shows a typical phase diagram of an element or a simple compound. The stability of solid, liquid and gas phases depends on the temperature and the pressure. The three phases are in equilibrium at the triple point. The gas and liquid phases are separated by a phase transition only below the temperature of the critical point.
potentiometric titration → potenciometrijska titracija
Potentiometric titration is a volumetric method in which the potential between two electrodes is measured (referent and indicator electrode) as a function of the added reagent volume. Types of potentiometric titrations for the determination of analytes in photoprocessing solutions include acid-base, redox, precipitation, and complexometric.
Potentiometric titrations are preferred to manual titrations, since they are more accurate and precise. They are also more easily adapted to automation, where automated titration systems can process larger volumes of samples with minimal analyst involvement.
A titration curve has a characteristic sigmoid curve. The part of the curve that has the maximum change marks the equivalence point of the titration. The first derivative, ΔE/ΔV, is the slope of the curve, and the endpoint occurs at the volume, V', where ΔE/ΔV has the maximum value.
standard → standard
Standards are materials containing a known concentration of an analyte. They provide a reference to determine unknown concentrations or to calibrate analytical instruments.
The accuracy of an analytical measurement is how close a result comes to the true value. Determining the accuracy of a measurement usually requires calibration of the analytical method with a known standard. This is often done with standards of several concentrations to make a calibration or working curve.
A primary standard is a reagent that is extremely pure, stable, has no waters of hydration, and has a high molecular weight.
A secondary standard is a standard that is prepared in the laboratory for a specific analysis. It is usually standardised against a primary standard.
standard deviation → standardna devijacija
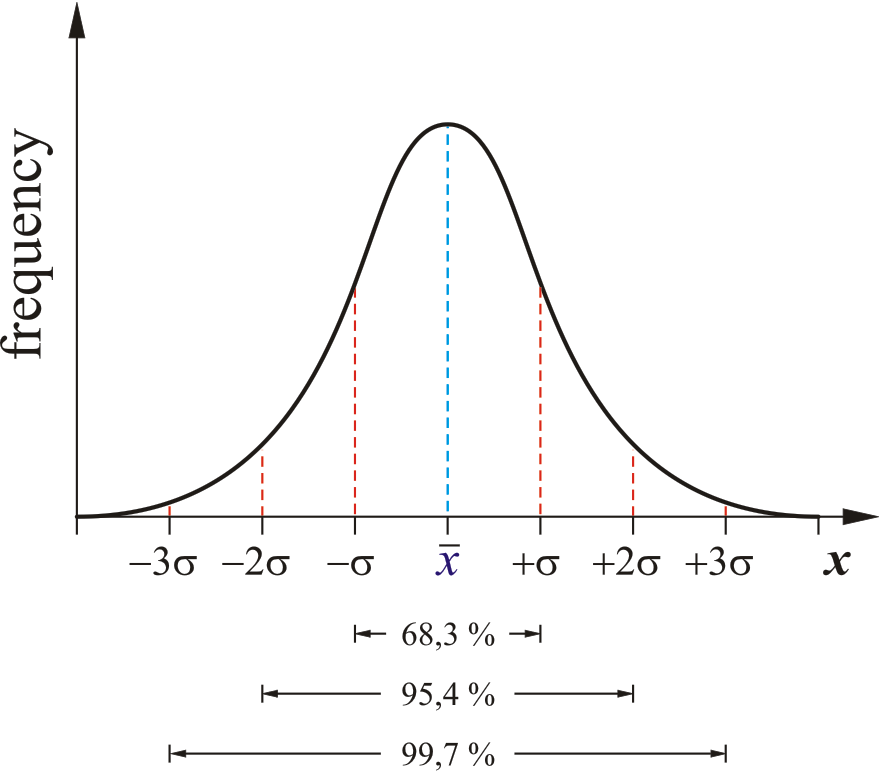
Standard deviation (σ) is a measure of the dispersion of a set of data from its mean. Standard deviation is a statistical term that measures the amount of variability or dispersion around an average
Suppose there are many measurements of a quantity presumed to be similar, like the size of peas in a pod. If the number of readings for each size were plotted, a bell-shaped curve would probably result, with a few small and large peas and most clustered around the average size. Around two-thirds of all measurements fall in the range spanned by the standard deviation, a measure of the spread.
Citing this page:
Generalic, Eni. "Hipsometrijska krivulja." Croatian-English Chemistry Dictionary & Glossary. 29 June 2022. KTF-Split. {Date of access}. <https://glossary.periodni.com>.