
CHEMISTRY GLOSSARY
reaction speed curve → krivulja brzine reakcije
Reaction speed curve is a graphic presentation of the reactant quantity change in dependence on time value.
solubility curve → krivulja topljivosti
Solubility curve is a graphic presentation of solubility change in dependence on temperature.
Hesse’s law → Hessov zakon
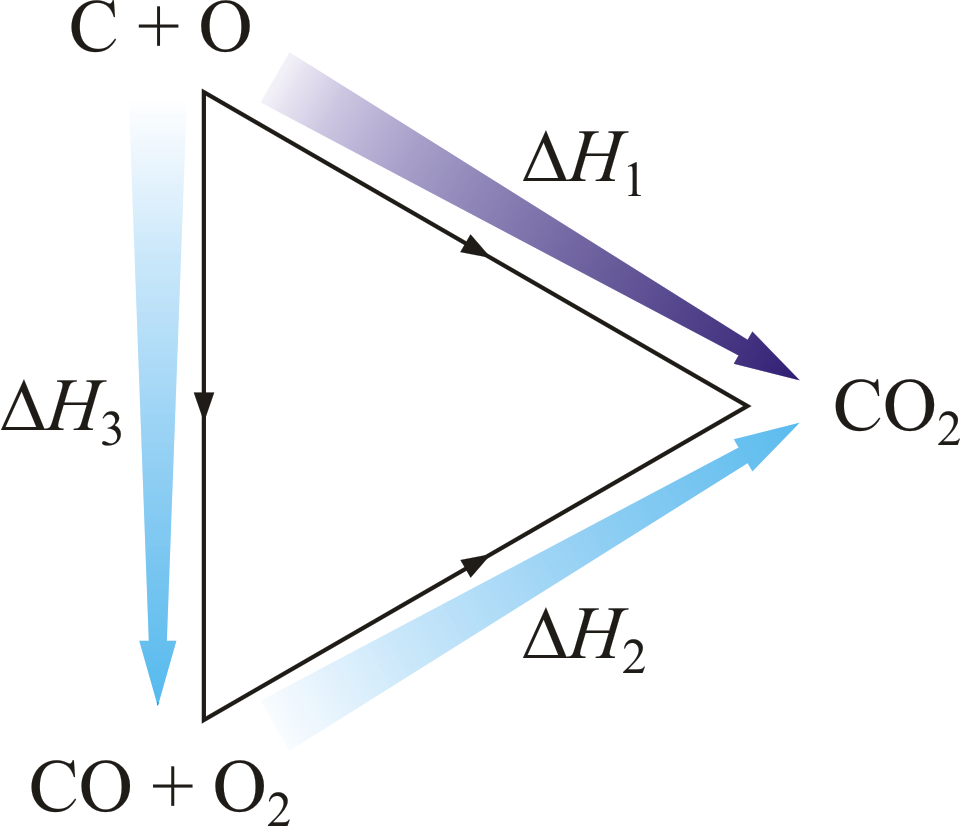
Hesse’s law says that reaction heat of some chemical change does not depend on the way in which the reaction is conducted, but only on starting and ending system state. Hesse’s law is also known as the law of constant heat summation. Hesse’s law is also known as the law of constant heat summation. The law was first put forward in 1840 by the Swiss-born Russian chemist Germain Henri Hess (1802-1850).
Hesse’s law can be used to obtain thermodynamic data that cannot be measured directly. For example, it is very difficult to control the oxidation of graphite to give pure CO. However, enthalpy for the oxidation of graphite to CO2 can easily be measured. So can the enthalpy of oxidation of CO to CO2. The application of Hess’s law enables us to estimate the enthalpy of formation of CO.
| C(s) + O2(g) →← CO2(g) | ΔrH1 = -393 kJ mol-1 |
| CO(g) + 1/2O2(g) →← CO2(g) | ΔrH2 = -283 kJ mol-1 |
| C(s) + 1/2O2(g) →← CO(g) | ΔrH3 = -110 kJ mol-1 |
The equation shows the standard enthalpy of formation of CO to be -110 kJ/mol.
standard deviation → standardna devijacija
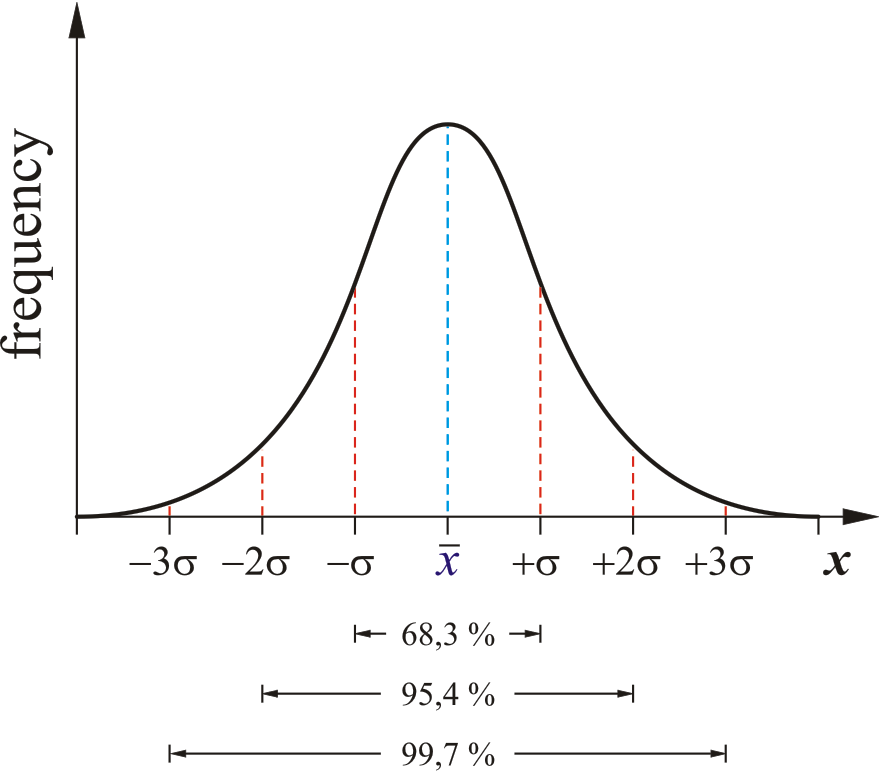
Standard deviation (σ) is a measure of the dispersion of a set of data from its mean. Standard deviation is a statistical term that measures the amount of variability or dispersion around an average
Suppose there are many measurements of a quantity presumed to be similar, like the size of peas in a pod. If the number of readings for each size were plotted, a bell-shaped curve would probably result, with a few small and large peas and most clustered around the average size. Around two-thirds of all measurements fall in the range spanned by the standard deviation, a measure of the spread.
titration curve → titracijska krivulja
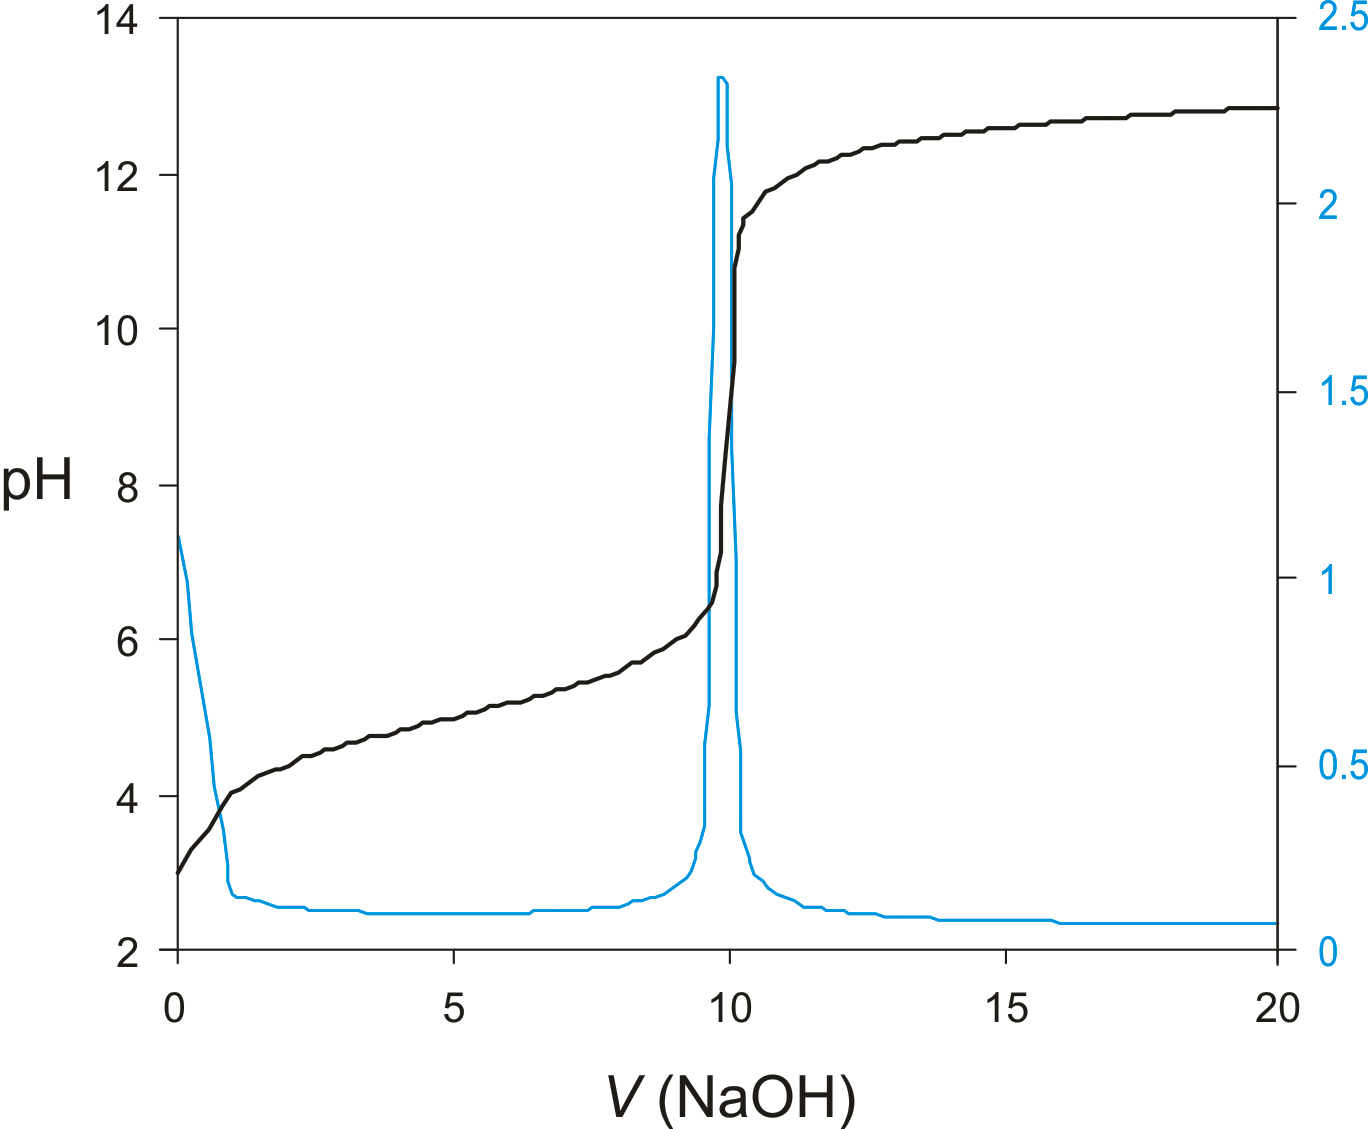
Titration curve is a graphic representation of the amount of a species present vs. volume of solution added during a titration. A titration curve has a characteristic sigmoid curve. The inflection point in the titration curve marks the end-point of the titration. Blue line is the first derivative of the titration curve.
Citing this page:
Generalic, Eni. "Grafit." Croatian-English Chemistry Dictionary & Glossary. 29 June 2022. KTF-Split. {Date of access}. <https://glossary.periodni.com>.