
CHEMISTRY GLOSSARY
Tafel plot → Tafelov dijagram
Tafel plot is the graph of the logarithm of the current density j against the overpotential η in electrochemistry in the high overpotential limit. An electrode when polarised frequently yields a current potential relationship over a region which can be approximated by:
where η is change in open circuit potential, i is the current density, B and i0 is constants. B is known as the Tafel Slope. If this behaviour is observed a plot of the semilogarithmic components is known as the Tafel line and the diagram is called the Tafel diagram.
Heyrovsky-Ilkovic equation → Heyrovsky-Ilkovičeva jednadžba
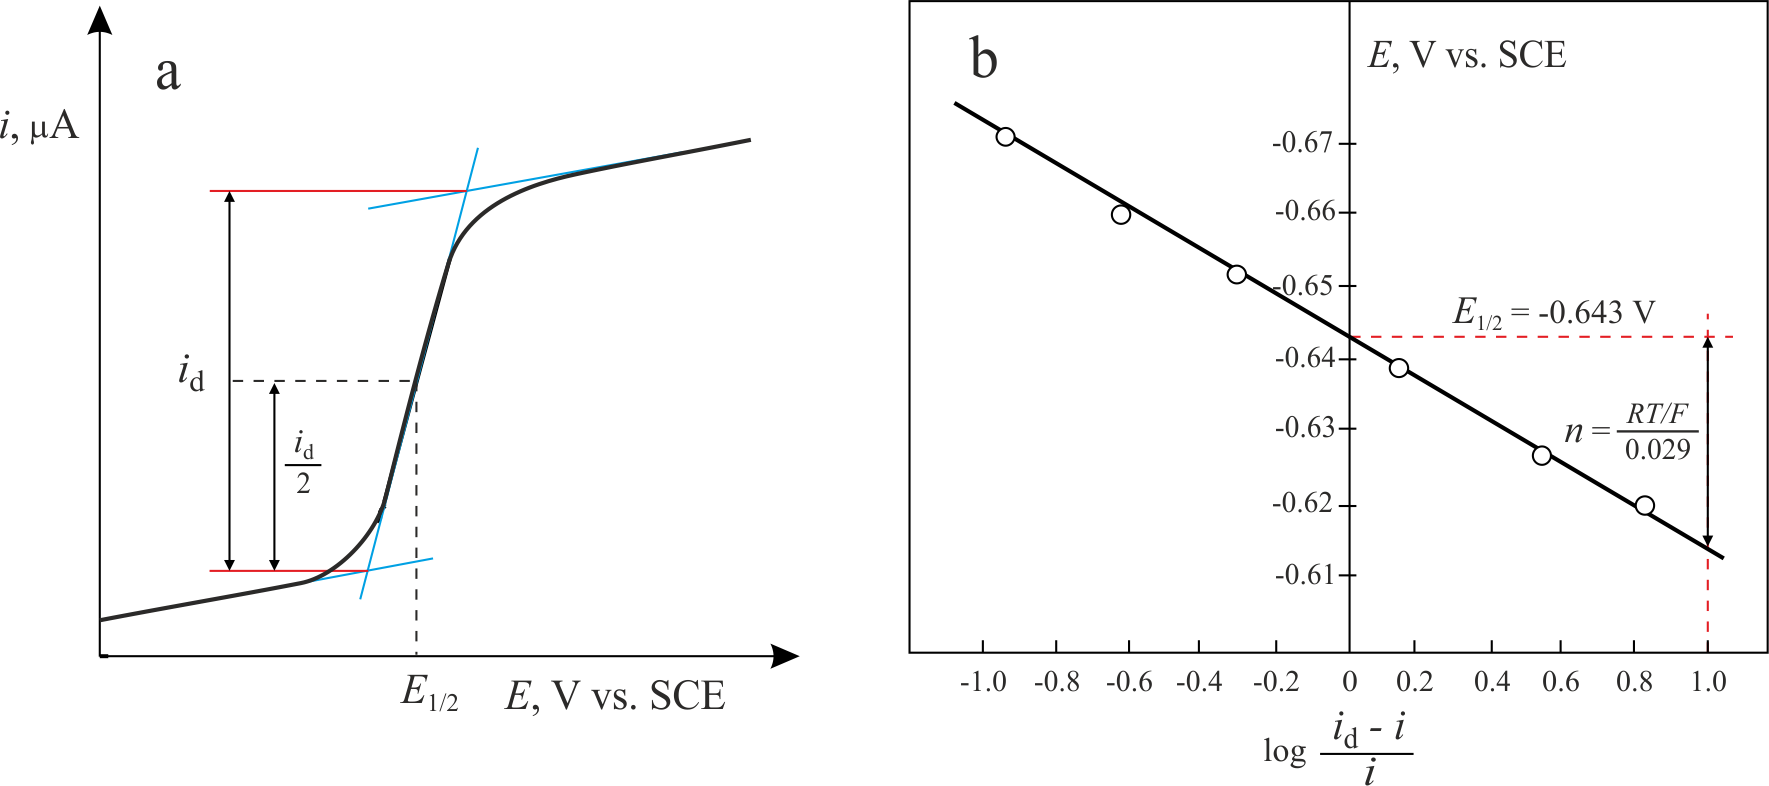
The Heyrovsky-Ilkovic equation describes the entire current-potential curve (polarographic wave) of a reversible redox system in polarography
where R is the gas constant, T is the absolute temperature, F is the Faraday constant, n denotes the number of electrons taking part in the electrode reaction. E1/2 is a unique potential (for a given reaction and supporting electrolyte) termed the half-wave potential.
In order to obtain E1/2 from the above equation, we plot a graph of ln[(id-i)/i] against E. The intercept on the x-axis gives then an accurate value of E1/2. The slope of the obtained straight line is equal to nF/RT from which n is determined.
Citing this page:
Generalic, Eni. "Elektrokemijski potencijal." Croatian-English Chemistry Dictionary & Glossary. 29 June 2022. KTF-Split. {Date of access}. <https://glossary.periodni.com>.