phase diagram → fazni dijagram
Phase diagram is a graphic representation of the equilibrium relationships between phases (such as vapour-liquid, liquid-solid) of a chemical compound, mixture of compounds, or solution.
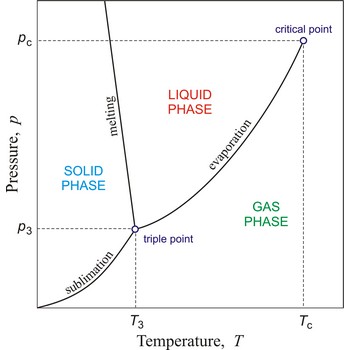
The figure shows a typical phase diagram of an element or a simple compound. The stability of solid, liquid and gas phases depends on the temperature and the pressure. The three phases are in equilibrium at the triple point. The gas and liquid phases are separated by a phase transition only below the temperature of the critical point.
Tafel plot → Tafelov dijagram
Tafel plot is the graph of the logarithm of the current density j against the overpotential η in electrochemistry in the high overpotential limit. An electrode when polarised frequently yields a current potential relationship over a region which can be approximated by:
where η is change in open circuit potential, i is the current density, B and i0 is constants. B is known as the Tafel Slope. If this behaviour is observed a plot of the semilogarithmic components is known as the Tafel line and the diagram is called the Tafel diagram.
T-S diagram → T-S dijagram
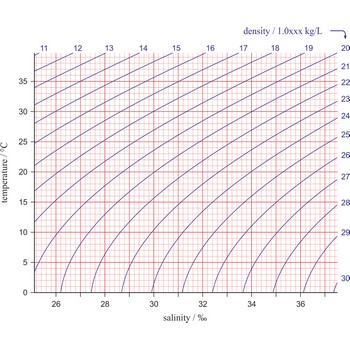
The relationship between the temperature (T) and the salinity (S) of a seawater can be illustrated graphically on a T-S diagram, which is a simple, but powerful tool used in studies of seawater density, mixing, and circulation. In a T-S diagram, temperature is plotted along the vertical axis in degrees Celsius and salinity is measured along the horizontal axis in PSU (Practical Salinity Units). Seawater density is illustrated in the diagram by curved lines of constant density (isopycnals). Water tends to move horizontally throughout the deep ocean, moving along lines of equal density.
critical point → kritična točka
In general, critical point is the point on the phase diagram of a two-phase system at which the two coexisting phases have identical properties and therefore represent a single phase. At the liquid-gas critical point of a pure substance, the distinction between liquid and gas vanishes, and the vapour pressure curve ends. The coordinates of this point are called the critical temperature and critical pressure. Above the critical temperature it is not possible to liquefy the substance.
critical pressure → kritični tlak
Critical pressure is the pressure of a fluid in its critical point; i.e. when it is at its critical temperature and critical volume.
critical temperature → kritična temperatura
Critical temperature is the temperature of the liquid-vapour critical point, that is, the temperature above which a gas cannot be liquefied by an increase of pressure.
supercritical fluid → superkritični fluid
Supercritical fluid is any substance above its critical temperature and critical pressure (see phase diagram). It shows unique properties that are different from those of either gases or liquids under standard conditions. A supercritical fluid has both the gaseous property of being able to penetrate anything, and the liquid property of being able to dissolve materials into their components. Solublity increases with increasing density (i.e. with increasing pressure). An example of this is naphthalene which is practically insoluble in low pressure carbon dioxide. At 100 bar the solubility is 10 g/L and at 200 bar it is 50 g/L. Rapid expansion of supercritical solutions leads to precipitation of a finely divided solid.
triple point → trojna točka
Triple point is the point in p,T space where the solid, liquid, and gas phases of a substance are in thermodynamic equilibrium.
Arrhenius equation → Arheniusova jednadžba
In 1889, Svante Arrhenius explained the variation of rate constants with temperature for several elementary reactions using the relationship
where the rate constant k is the total frequency of collisions between reaction molecules A times the fraction of collisions exp(-Ea/RT) that have an energy that exceeds a threshold activation energy Ea at a temperature of T (in kelvin). R is the universal gas constant.
azeotrope → azeotropi
Azeotrope is a mixture of two liquids that boils at constant composition, i.e. the composition of the vapour is the same as that of the liquid. Azeotropes occur because of deviations in Raoult’s law leading to a maximum or minimum in the boiling point - composition diagram. The composition of an azeotrope depends on the pressure.
Citing this page:
Generalic, Eni. "Fazni dijagram." Croatian-English Chemistry Dictionary & Glossary. 29 June 2022. KTF-Split. {Date of access}. <https://glossary.periodni.com>.
Glossary
Periodic Table


