
CHEMISTRY GLOSSARY
phase diagram → fazni dijagram
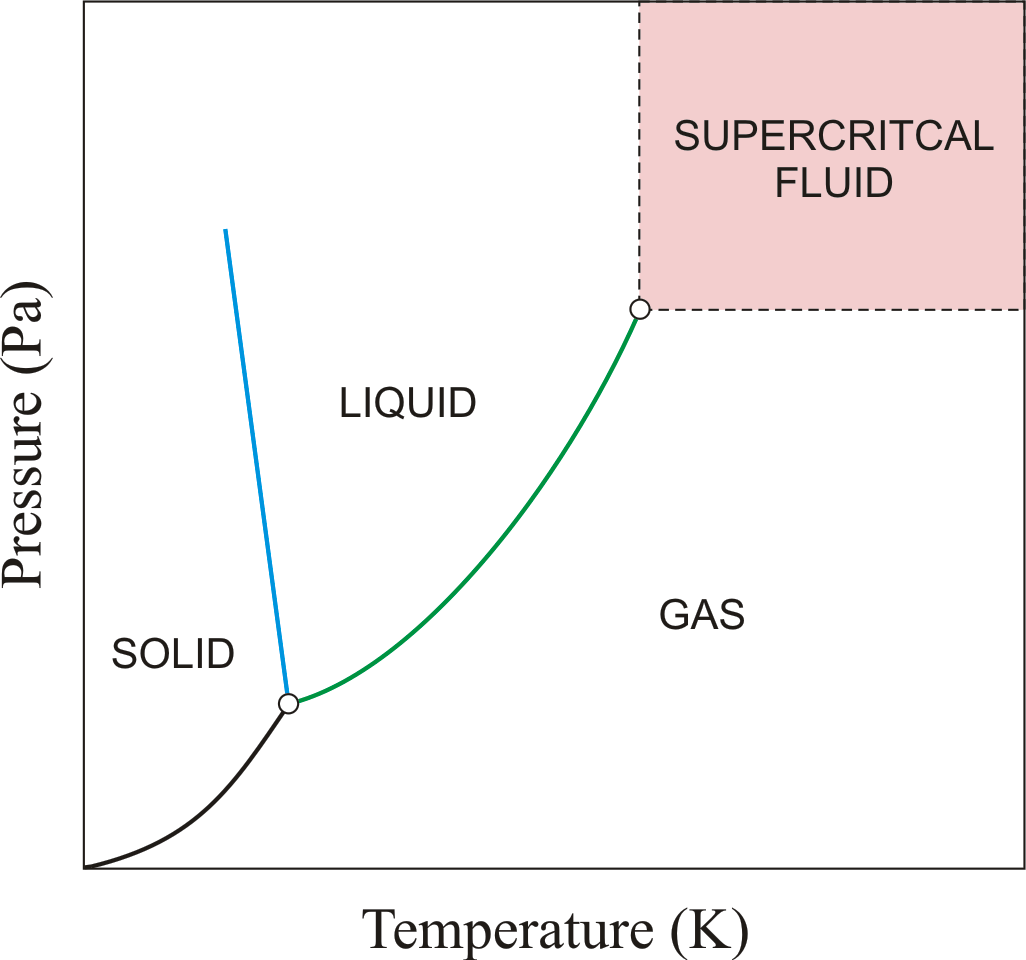
Phase diagram is a graphic representation of the equilibrium relationships between phases (such as vapour-liquid, liquid-solid) of a chemical compound, mixture of compounds, or solution.
The figure shows a typical phase diagram of an element or a simple compound. The stability of solid, liquid and gas phases depends on the temperature and the pressure. The three phases are in equilibrium at the triple point. The gas and liquid phases are separated by a phase transition only below the temperature of the critical point.

Gibbs phase rule → Gibbsov zakon faza
Gibbs phase rule is the relationship used to determine the number of state variables, usually chosen from among temperature, pressure, and species composition in each phase, which must be specified to fix the thermodynamic state of a system in equilibrium:
where C is the number of components in a mixture, P is the number of phases, and F is the degrees of freedom, i.e., the number of intensive variables that can be changed independently without affecting the number of phases.
T-S diagram → T-S dijagram
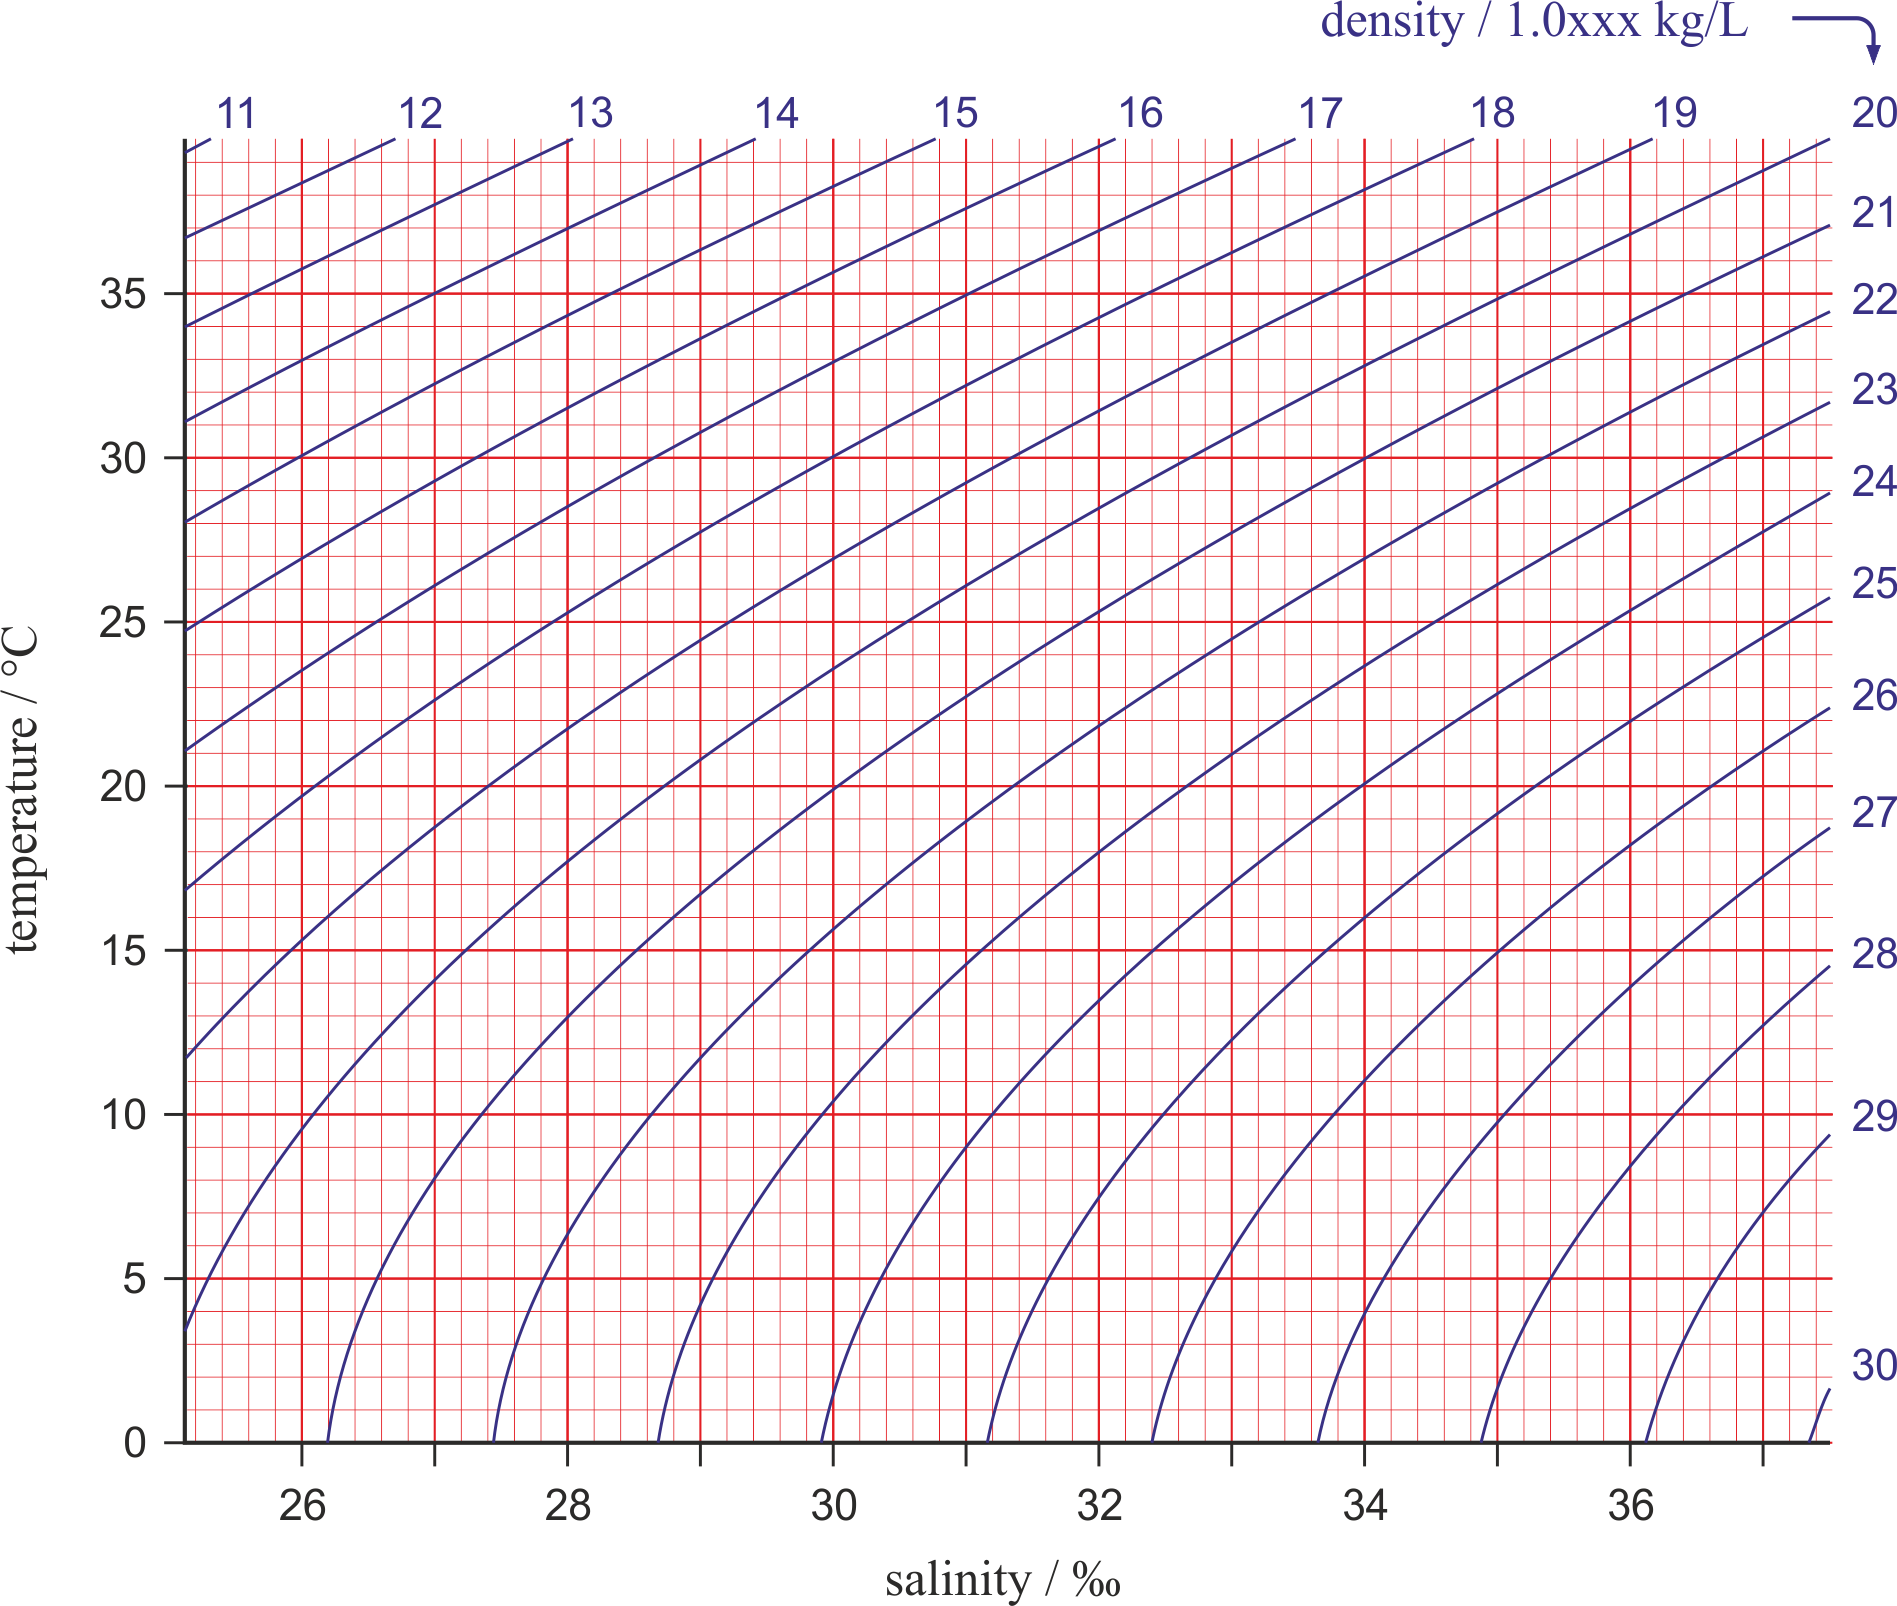
The relationship between the temperature (T) and the salinity (S) of a seawater can be illustrated graphically on a T-S diagram, which is a simple, but powerful tool used in studies of seawater density, mixing, and circulation. In a T-S diagram, temperature is plotted along the vertical axis in degrees Celsius and salinity is measured along the horizontal axis in PSU (Practical Salinity Units). Seawater density is illustrated in the diagram by curved lines of constant density (isopycnals). Water tends to move horizontally throughout the deep ocean, moving along lines of equal density.
critical point → kritična točka
In general, critical point is the point on the phase diagram of a two-phase system at which the two coexisting phases have identical properties and therefore represent a single phase. At the liquid-gas critical point of a pure substance, the distinction between liquid and gas vanishes, and the vapour pressure curve ends. The coordinates of this point are called the critical temperature and critical pressure. Above the critical temperature it is not possible to liquefy the substance.
critical pressure → kritični tlak
Critical pressure is the pressure of a fluid in its critical point; i.e. when it is at its critical temperature and critical volume.
critical temperature → kritična temperatura
Critical temperature is the temperature of the liquid-vapour critical point, that is, the temperature above which a gas cannot be liquefied by an increase of pressure.
supercritical fluid → superkritični fluid
Supercritical fluid is any substance above its critical temperature and critical pressure (see phase diagram). It shows unique properties that are different from those of either gases or liquids under standard conditions. A supercritical fluid has both the gaseous property of being able to penetrate anything, and the liquid property of being able to dissolve materials into their components. Solublity increases with increasing density (i.e. with increasing pressure). An example of this is naphthalene which is practically insoluble in low pressure carbon dioxide. At 100 bar the solubility is 10 g/L and at 200 bar it is 50 g/L. Rapid expansion of supercritical solutions leads to precipitation of a finely divided solid.
triple point → trojna točka
Triple point is the point in p,T space where the solid, liquid, and gas phases of a substance are in thermodynamic equilibrium.
absorption → apsorpcija
Absorption is a phenomenon that occurs when matter crosses from one phase to another passing through the border surface and in the other phase more or less monotonously distributes itself in a concentration higher than the one within the first phase.
Citing this page:
Generalic, Eni. "Phase diagram." Croatian-English Chemistry Dictionary & Glossary. 29 June 2022. KTF-Split. {Date of access}. <https://glossary.periodni.com>.